Qlik Sense Business Analyst Certification Exam v1.0
Question 1
A wholesaler needs to show sales and products in a PowerPoint presentation.
The dimensions and measures are:
✑ Product Name
✑ Sum of Sales
✑ Number of Orders
Which two chart types could the business analyst use to meet these requirements? (Choose two.)
- A. Stacked bar chart
- B. Combo chart
- C. Scatter plot
- D. Distribution plot
- E. Treemap
Answer : AC
Question 2
A hospital has a large number of users who create their own visualizations in Qlik Sense Enterprise. The hospital has several requirements:
✑ Users must be able to create their own visualizations
✑ Users can duplicate and modify existing sheets
✑ New visualizations can be shared among the work groups in a governed and controlled way
✑ User created objects and sheets can be included in the base sheets
Which three privileges will meet these requirements? (Choose three.)
- A. Users can publish sheets to the Community section
- B. The app owner can promote community sheets to base sheets
- C. Users can promote community sheets to base sheets
- D. Users can replace base sheets with community sheets
- E. Users can copy and modify base sheets
Answer : ABE
Question 3
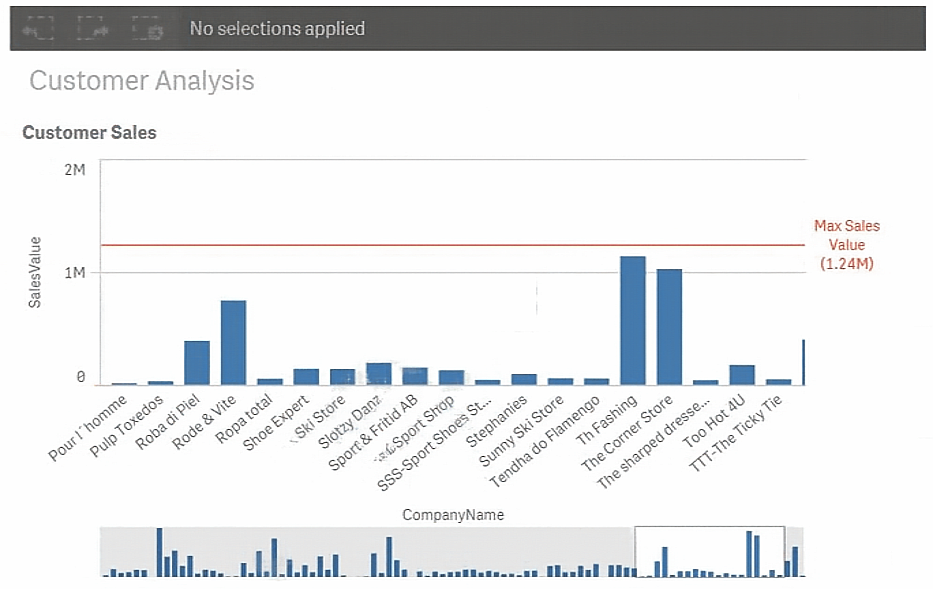
Refer to the exhibit.
A business analyst needs to add a reference line to a bar chart.
Which action should the business analyst take to meet this requirement?
- A. Select the Max trend line in the properties panel of the bar chart
- B. Create a calculated field in the data manager and use it as a chart expression
- C. Create a reference line using Max(Aggr(Sum(Sales),CompanyName))
- D. Create a reference line using Aggr(Max(Sum(Sales),CompanyName))
Answer : C
Question 4
Which three actions can a business analyst complete in the Qlik Sense Enterprise hub? (Choose three.)
- A. Grant users access to a stream
- B. Load data from multiple sources
- C. Publish an app into a stream
- D. Publish a sheet into the Community section
- E. Schedule a reload of an app
Answer : ACD
Question 5
The sales department requests a new Qlik Sense app to show the amount of sales in each territory. The app must:
✑ Allow analysis of aggregate views of big data stores
✑ Include objects that allow the user to jump to a specific sheet
✑ Provide a way to send a report through email
Which three products or features should the business analyst use to meet these requirements? (Choose three.)
- A. On Demand App Generation
- B. Bookmarks
- C. Qlick Sense Enterprise for Elastic
- D. Qlick NPrinting
- E. Qlick DataMarket
Answer : ADE
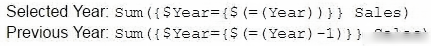
Question 6
A business analyst must create an interactive table to analyze sales performance for the selected year and the previous year.
Which are the correct expressions to meet this requirement?
A.

B.
C.

D.
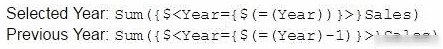
Answer : B
Question 7
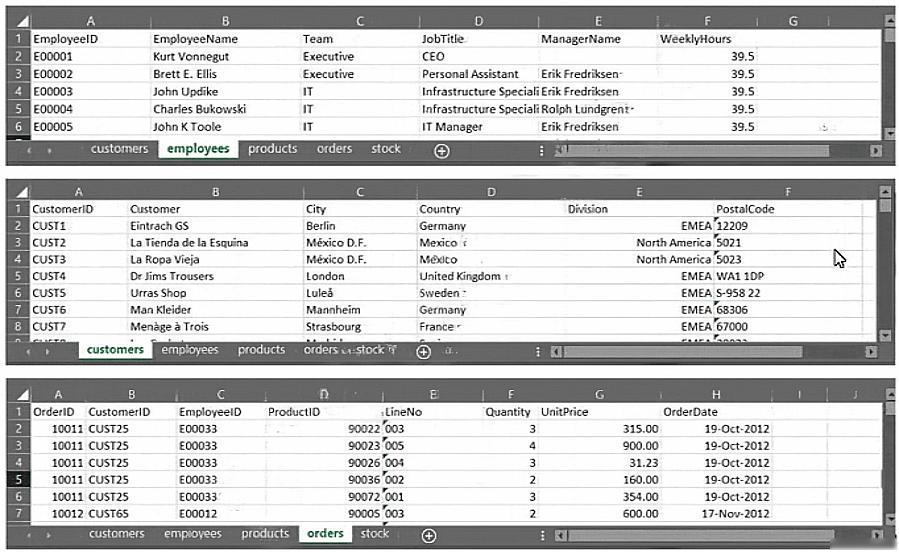
Refer to the exhibit.
A business analyst must provide a visualization to show the trends of the number of orders generated per employee. The Customer must be searchable.
EmployeeID, EmployeeName, OrderID, and CustomerID will be included in the load.
Which additional fields must be loaded to meet this requirement?
- A. OrderDate, Customer, ProductID
- B. Customer, ProductID
- C. OrderDate, Customer
- D. OrderDate, UnitPrice
Answer : C
Question 8
A marketing team needs to analyze current sales by age groups in a bar chart. The following age groups are created in the data manager, and the field is named
AgeGroup:
✑ Children: 16 years old and younger
✑ YoungAdult: 17 to 30 years old
✑ Adult: 31 years old and older
The business analyst will use an expression to set the colors for the bars:
If ([AgeGroup] = ג€˜Childrenג€™, Red(), If ([AgeGroup] = ג€˜YoungAdultג€™, Blue(), Green()))
Which steps must be completed to apply the correct colors in the visualization?
- A. Select Data in the properties panel and create a calculated dimension using the expression editor.
- B. Create a master item dimension using the expression, in the visualization, select Color by dimension and use the newly created master item.
- C. Under Appearance in the properties panel, select Color, then select Color by expression, and make sure that The expression is a color code is checked.
- D. Create a master item measure using the expression. In the visualization, select Color by measure and use the newly created master item.
Answer : C
Question 9
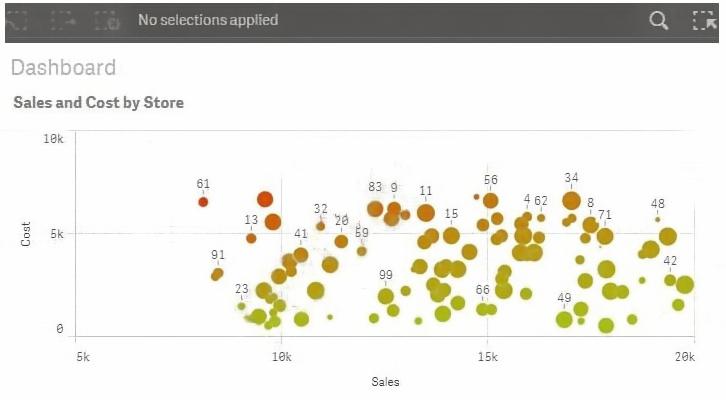
Refer to the exhibit.
A range of colors between red (using code RGB(229,20,0)) and green (using code RGB(164,196,23)) needs to be used as a gradient in a scatter plot that displays sales and cost by store. The gradient needs to produce visualization shown in the exhibit.
What is the most efficient method a business analyst should use to meet this requirement?
- A. Modify the visualization to set a color for the data points with an expression based on a Colormix 1 function
- B. Create a new calculation in the data model with the Colormix1 function that can be used as a gradient in the visualization
- C. Modify the default CSS file to produce the required color gradient
- D. Create a new measure in the master items with the Colormix2 function so that the gradient can be used in any visualization
Answer : A
Question 10
A business analyst needs to make a complex pie chart easier to understand. The pie chart shows the total number of customers by customer type. There are 12 customer types. Some customers do NOT have a type assigned.
The business analyst needs to:
✑ Show all customers including those without a customer type
✑ See the total number of customers in each customer type
Which two visualizations could the business analyst use to meet these requirements? (Choose two.)
- A. Donut
- B. Treemap
- C. KPI
- D. Scatter plot
- E. Bar chart
Answer : BE
Question 11
A business analyst is using a box plot to show distribution. The data scientist provides the formulas to configure a custom box plot.
Which action(s) should the business analyst take to meet these requirements?
- A. Under Box plot elements, disable Use presets and enter the given formulas as calculated dimensions
- B. Under Box plot elements, disable Use presets and enter the given formulas in the expressions field
- C. Select Add measure, and enter the given formulas as expressions
- D. Create variables and enter the given formulas as expressions
Answer : A
Question 12
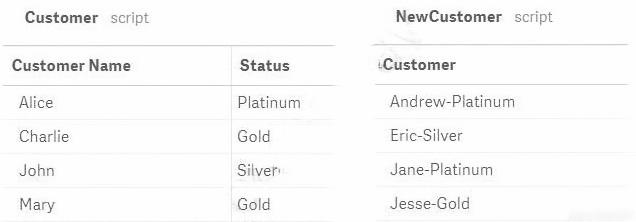
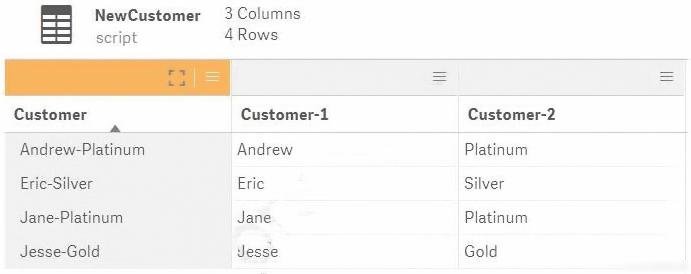
Refer to the exhibit.
The data architect informs the business analyst of an additional data source for Customer data. The values are stored in a different format.
Users do NOT need to display values in the current format for the NewCustomer.
The business analyst has split the ג€˜Customerג€™ column into two new fields in the New Customer table.
Which steps should the business analyst take to finish integrating the new customer records into the existing visualizations?
- A. 1. Click on the Customer table 2. Select Concatenate tables in the ג€˜ג€¦ג€™ option menu 3. Select the New Customer table 4. Edit Mappings to align the ג€˜Customer Nameג€™ and ג€˜Statusג€™ columns from the two tables 5. Remove the remaining third column from the ג€˜New Customerג€™ row
- B. 1. Click on the NewCustomer table 2. Select Concatenate tables in the ג€˜ג€¦ג€™ option menu 3. Select the Customer table 4. Edit Mappings to align the ג€˜Customer Nameג€™ and ג€˜Statusג€™ columns from the two tables 5. Rename the columns to ג€˜Customer Nameג€™ and ג€˜Statusג€™
- C. 1. Click on the Customer table 2. Select Concatenate tables in the ג€˜ג€¦ג€™ option menu 3. Select the New Customer table 4. Edit Mappings to align the ג€˜Customer Nameג€™ and ג€˜Statusג€™ columns from the two tables 5. Rename the columns to ג€˜Customer Nameג€™ and ג€˜Statusג€™
- D. 1. Click on the NewCustomer table 2. Select Concatenate tables in the ג€˜ג€¦ג€™ option menu 3. Select the Customer table 4. Edit Mappings to align the ג€˜Customer Nameג€™ and ג€˜Statusג€™ columns from the two tables 5. Remove the remaining third column from the ג€˜New Customerג€™ row
Answer : A
Question 13
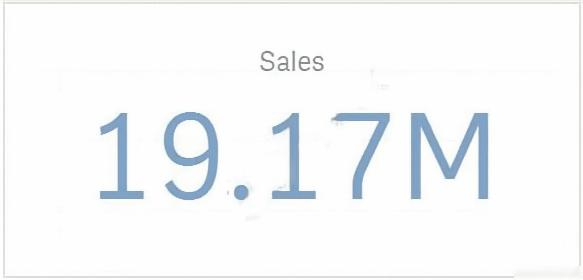
Refer to the exhibit.
A business analyst creates a KPI visualization to show the total global sales for a large organization. When an expression is written, the default format appears as shown.
The business users must be able to see the actual number to the last dollar value (e.g., $19,169,020) whenever this KPI is used.
Which actions should the business analyst take to meet the requirement?
- A. 1. Change the number format to money 2. Check Remove Decimal Points under Appearance > Presentation 3. Add the KPI to the master items
- B. 1. Change the number format to USD 2. Check Remove Decimal Points under Appearance > Presentation 3. Add the KPI to the master items
- C. 1. Change the number format to USD 2. Change the format pattern to remove decimal points 3. Add the KPI to the master items
- D. 1. Change the number format to money 2. Change the format pattern to remove decimal points 3. Add the KPI to the master items
Answer : D
Question 14
A manufacturer uses a dashboard for analysis. Users created many bookmarks to simplify their workflow. An administrator also created some bookmarks in the app based on user feedback.
The organization needs to republish the app and maintain both the usersג€™ and administratorג€™s bookmarks.
Which steps should the business analyst take to meet this requirement?
A.
✑ Duplicate the app in Work
✑ Request bookmark owner to publish bookmark
✑ Replace the existing app
B.
✑ Duplicate the app in Work
✑ Review previous bookmarks
✑ Replace the existing published app
C.
✑ Review previous bookmarks
✑ Copy the app to a new stream
✑ Publish the app in the new stream
D.
✑ Create a duplicate copy of the app
✑ Delete the published app
✑ Publish the duplicate app
Answer : D
Question 15
A CEO of an automotive manufacturing company wants a single dashboard sheet to track the companyג€™s sales.
The app must meet several requirements:
✑ All charts must be on one sheet
✑ Show summary charts of key performance data
✑ Ability to scroll up and down the sheet
Which set of actions should the business analyst use to meet these requirement?
- A. Use KPI objects Use Insight Advisor
- B. Adjust grid spacing Use Insight Advisor
- C. Use KPI objects Activate Chart assistance
- D. Activate grid spacing Activate Extend sheet
Answer : A