Analyzing Data with Microsoft Power BI v1.0
Question 1
Case Study -
This is a case study. Case studies are not timed separately. You can use as much exam time as you would like to complete each case. However, there may be additional case studies and sections on this exam. You must manage your time to ensure that you are able to complete all questions included on this exam in the time provided.
To answer the questions included in a case study, you will need to reference information that is provided in the case study. Case studies might contain exhibits and other resources that provide more information about the scenario that is described in the case study. Each question is independent of the other question on this case study.
At the end of this case study, a review screen will appear. This screen allows you to review your answers and to make changes before you move to the next section of the exam. After you begin a new section, you cannot return to this section.
To start the case study -
To display the first question on this case study, click the Next button. Use the buttons in the left pane to explore the content of the case study before you answer the questions. Clicking these buttons displays information such as business requirements, existing environment, and problem statements. If the case study has an All Information tab, note that the information displayed is identical to the information displayed on the subsequent tabs. When you are ready to answer a question, click the Question button to return to the question.
Overview -
Litware, Inc. is an online retailer that uses Microsoft Power BI dashboards and reports.
The company plans to leverage data from Microsoft SQL Server databases, Microsoft Excel files, text files, and several other data sources.
Litware uses Azure Active Directory (Azure AD) to authenticate users.
Existing Environment -
Sales Data -
Litware has online sales data that has the SQL schema shown in the following table.
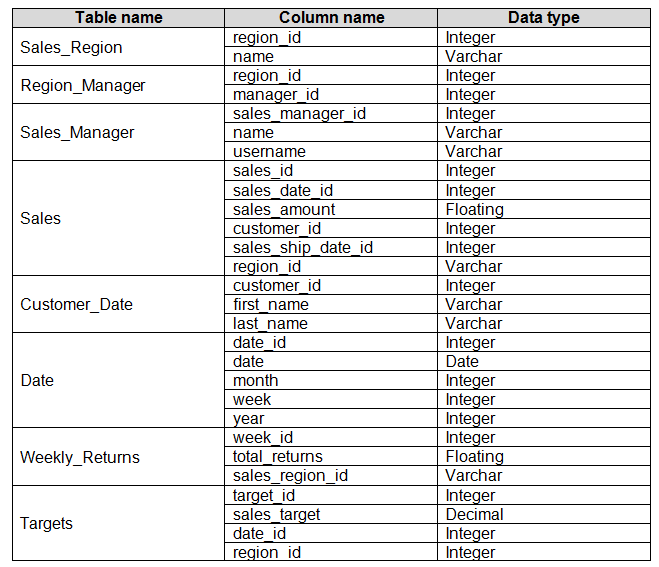
In the Date table, the date_id column has a format of yyyymmdd and the month column has a format of yyyymm.
The week column in the Date table and the week_id column in the Weekly_Returns table have a format of yyyyww.
The sales_id column in the Sales table represents a unique transaction.
The region_id column can be managed by only one sales manager.
Data Concerns -
You are concerned with the quality and completeness of the sales data. You plan to verify the sales data for negative sales amounts.
Reporting Requirements -
Litware identifies the following technical requirements:
Executives require a visual that shows sales by region.
Regional managers require a visual to analyze weekly sales and returns.
Sales managers must be able to see the sales data of their respective region only.
The sales managers require a visual to analyze sales performance versus sales targets.
The sale department requires reports that contain the number of sales transactions.
Users must be able to see the month in reports as shown in the following example: Feb 2020.
The customer service department requires a visual that can be filtered by both sales month and ship month independently.
You need to create a relationship between the Weekly_Returns table and the Date table to meet the reporting requirements of the regional managers.
What should you do?
- A. Add the Weekly_Returns data to the Sales table by using RELATED DAX functions.
- B. In the Weekly_Returns table, create a new calculated column named date_id in a format of yyyymmdd and use the calculated column to create a relationship to the Date table.
- C. Create a new table based on the Date table where date_id is unique, and then create a many-to-many relationship to Weekly_Return.
Answer : B
Explanation:
Scenario: Regional managers require a visual to analyze weekly sales and returns.
To relate the two tables we need a common column.
Question 2
Case Study -
This is a case study. Case studies are not timed separately. You can use as much exam time as you would like to complete each case. However, there may be additional case studies and sections on this exam. You must manage your time to ensure that you are able to complete all questions included on this exam in the time provided.
To answer the questions included in a case study, you will need to reference information that is provided in the case study. Case studies might contain exhibits and other resources that provide more information about the scenario that is described in the case study. Each question is independent of the other question on this case study.
At the end of this case study, a review screen will appear. This screen allows you to review your answers and to make changes before you move to the next section of the exam. After you begin a new section, you cannot return to this section.
To start the case study -
To display the first question on this case study, click the Next button. Use the buttons in the left pane to explore the content of the case study before you answer the questions. Clicking these buttons displays information such as business requirements, existing environment, and problem statements. If the case study has an All Information tab, note that the information displayed is identical to the information displayed on the subsequent tabs. When you are ready to answer a question, click the Question button to return to the question.
Overview -
Litware, Inc. is an online retailer that uses Microsoft Power BI dashboards and reports.
The company plans to leverage data from Microsoft SQL Server databases, Microsoft Excel files, text files, and several other data sources.
Litware uses Azure Active Directory (Azure AD) to authenticate users.
Existing Environment -
Sales Data -
Litware has online sales data that has the SQL schema shown in the following table.
In the Date table, the date_id column has a format of yyyymmdd and the month column has a format of yyyymm.
The week column in the Date table and the week_id column in the Weekly_Returns table have a format of yyyyww.
The sales_id column in the Sales table represents a unique transaction.
The region_id column can be managed by only one sales manager.
Data Concerns -
You are concerned with the quality and completeness of the sales data. You plan to verify the sales data for negative sales amounts.
Reporting Requirements -
Litware identifies the following technical requirements:
Executives require a visual that shows sales by region.
Regional managers require a visual to analyze weekly sales and returns.
Sales managers must be able to see the sales data of their respective region only.
The sales managers require a visual to analyze sales performance versus sales targets.
The sale department requires reports that contain the number of sales transactions.
Users must be able to see the month in reports as shown in the following example: Feb 2020.
The customer service department requires a visual that can be filtered by both sales month and ship month independently.
You need to create relationships to meet the reporting requirements of the customer service department.
What should you create?
- A. an additional date table named ShipDate, a one-to-many relationship from Date[date_id] to Sales[Sales_date_id], and a one-to-many relationship from ShipDate[date_id] to Sales[sales_ship_date_id]
- B. an additional date table named ShipDate, a many-to-many relationship from Sales[sales_date_id] to Date[date_id], and a many-to-many relationship from Sales[sales_ship_date_id] to ShipDate[date_id]
- C. a one-to-many relationship from Date[date_id] to Sales[sales_date_id] and another one-to-many relationship from Date[date_id] to Weekly_Returns[week_id]
- D. a one-to-many relationship from Sales[sales_date_id] to Date[date_id] and a one-to-many relationship from Sales[sales_ship_date_id] to Date[date_id]
Answer : A
Explanation:
Scenario: The customer service department requires a visual that can be filtered by both sales month and ship month independently.
In Power BI Desktop, only one relationship can be active between a Fact table and Dimension table, so we need an extra table.
Use one-to-many relationship to be able to filter.
Incorrect Answers:
C: Cannot make a relation between a date_id and a week_id.
D: The one-to-many relationships between the Sales and the Date tables goes in the other direction: for each date there can be many sales or shipments.
Reference:
https://docs.microsoft.com/en-us/power-bi/transform-model/desktop-relationships-understand
Model the Data -
Question 3
Case Study -
This is a case study. Case studies are not timed separately. You can use as much exam time as you would like to complete each case. However, there may be additional case studies and sections on this exam. You must manage your time to ensure that you are able to complete all questions included on this exam in the time provided.
To answer the questions included in a case study, you will need to reference information that is provided in the case study. Case studies might contain exhibits and other resources that provide more information about the scenario that is described in the case study. Each question is independent of the other question on this case study.
At the end of this case study, a review screen will appear. This screen allows you to review your answers and to make changes before you move to the next section of the exam. After you begin a new section, you cannot return to this section.
To start the case study -
To display the first question on this case study, click the Next button. Use the buttons in the left pane to explore the content of the case study before you answer the questions. Clicking these buttons displays information such as business requirements, existing environment, and problem statements. If the case study has an All Information tab, note that the information displayed is identical to the information displayed on the subsequent tabs. When you are ready to answer a question, click the Question button to return to the question.
Overview -
Contoso, Ltd. is a manufacturing company that produces outdoor equipment. Contoso has quarterly board meetings for which financial analysts manually prepare
Microsoft Excel reports, including profit and loss statements for each of the company's four business units, a company balance sheet, and net income projections for the next quarter.
Existing Environment -
Data and Sources -
Data for the reports comes from three sources. Detailed revenue, cost, and expense data comes from an Azure SQL database. Summary balance sheet data comes from Microsoft Dynamics 365 Business Central. The balance sheet data is not related to the profit and loss results, other than they both relate dates.
Monthly revenue and expense projections for the next quarter come from a Microsoft SharePoint Online list. Quarterly projections relate to the profit and loss results by using the following shared dimensions: date, business unit, department, and product category.
Net Income Projection Data -
Net income projection data is stored in a SharePoint Online list named Projections in the format shown in the following table.
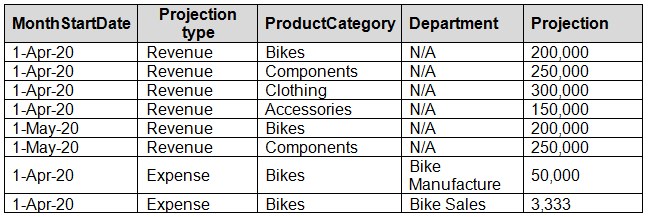
Revenue projections are set at the monthly level and summed to show projections for the quarter.
Balance Sheet Data -
The balance sheet data is imported with final balances for each account per month in the format shown in the following table.
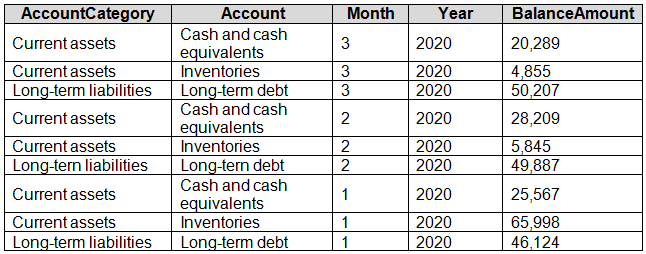
There is always a row for each account for each month in the balance sheet data.
Dynamics 365 Business Central Data
Business Central contains a product catalog that shows how products roll up to product categories, which roll up to business units.
Revenue data is provided at the date and product level. Expense data is provided at the date and department level.
Business Issues -
Historically, it has taken two analysts a week to prepare the reports for the quarterly board meetings. Also, there is usually at least one issue each quarter where a value in a report is wrong because of a bad cell reference in an Excel formula. On occasion, there are conflicting results in the reports because the products and departments that roll up to each business unit are not defined consistently.
Requirements -
Planned Changes -
Contoso plans to automate and standardize the quarterly reporting process by using Microsoft Power BI. The company wants to how long it takes to populate reports to less than two days. The company wants to create common logic for business units, products, and departments to be used across all reports, including, but not limited, to the quarterly reporting for the board.
Technical Requirements -
Contoso wants the reports and datasets refreshed with minimal manual effort.
The company wants to provide a single package of reports to the board that contains custom navigation and links to supplementary information.
Maintenance, including manually updating data and access, must be minimized as much as possible.
Security Requirements -
The reports must be made available to the board from powerbi.com. A mail-enabled security group will be used to share information with the board.
The analysts responsible for each business unit must see all the data the board sees, except the profit and loss data, which must be restricted to only their business unit's data. The analysts must be able to build new reports from the dataset that contains the profit and loss data, but any reports that the analysts build must not be included in the quarterly reports for the board. The analysts must not be able to share the quarterly reports with anyone.
Report Requirements -
You plan to relate the balance sheet to a standard date table in Power BI in a many-to-one relationship based on the last day of the month. At least one of the balance sheet reports in the quarterly reporting package must show the ending balances for the quarter, as well as for the previous quarter.
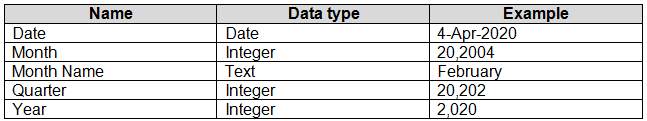
Projections must contain a column named RevenueProjection that contains the revenue projection amounts. A relationship must be created from Projections to a table named Date that contains the columns shown in the following table.
The definitions and attributes of products, departments, and business units must be consistent across all reports.
The board must be able to get the following information from the quarterly reports:
Revenue trends over time
Ending balances for each account
A comparison of expenses versus projections by quarter
Changes in long-term liabilities from the previous quarter
A comparison of quarterly revenue versus the same quarter during the prior year
Which DAX expression should you use to get the ending balances in the balance sheet reports?
- A. CALCULATE ( SUM( BalanceSheet [BalanceAmount] ), DATESQTD( 'Date'[Date] ) )
- B. CALCULATE ( SUM( BalanceSheet [BalanceAmount] ), LASTDATE( 'Date'[Date] ) )
- C. FIRSTNONBLANK ( 'Date' [Date] SUM( BalanceSheet[BalanceAmount] ) )
- D. CALCULATE ( MAX( BalanceSheet[BalanceAmount] ), LASTDATE( 'Date' [Date] ) )
Answer : A
Explanation:
Scenario: At least one of the balance sheet reports in the quarterly reporting package must show the ending balances for the quarter, as well as for the previous quarter.
DATESQTD returns a table that contains a column of the dates for the quarter to date, in the current context.
Reference:
https://docs.microsoft.com/en-us/dax/datesqtd-function-dax
Question 4
Case Study -
This is a case study. Case studies are not timed separately. You can use as much exam time as you would like to complete each case. However, there may be additional case studies and sections on this exam. You must manage your time to ensure that you are able to complete all questions included on this exam in the time provided.
To answer the questions included in a case study, you will need to reference information that is provided in the case study. Case studies might contain exhibits and other resources that provide more information about the scenario that is described in the case study. Each question is independent of the other question on this case study.
At the end of this case study, a review screen will appear. This screen allows you to review your answers and to make changes before you move to the next section of the exam. After you begin a new section, you cannot return to this section.
To start the case study -
To display the first question on this case study, click the Next button. Use the buttons in the left pane to explore the content of the case study before you answer the questions. Clicking these buttons displays information such as business requirements, existing environment, and problem statements. If the case study has an All Information tab, note that the information displayed is identical to the information displayed on the subsequent tabs. When you are ready to answer a question, click the Question button to return to the question.
Overview -
Contoso, Ltd. is a manufacturing company that produces outdoor equipment. Contoso has quarterly board meetings for which financial analysts manually prepare
Microsoft Excel reports, including profit and loss statements for each of the company's four business units, a company balance sheet, and net income projections for the next quarter.
Existing Environment -
Data and Sources -
Data for the reports comes from three sources. Detailed revenue, cost, and expense data comes from an Azure SQL database. Summary balance sheet data comes from Microsoft Dynamics 365 Business Central. The balance sheet data is not related to the profit and loss results, other than they both relate dates.
Monthly revenue and expense projections for the next quarter come from a Microsoft SharePoint Online list. Quarterly projections relate to the profit and loss results by using the following shared dimensions: date, business unit, department, and product category.
Net Income Projection Data -
Net income projection data is stored in a SharePoint Online list named Projections in the format shown in the following table.
Revenue projections are set at the monthly level and summed to show projections for the quarter.
Balance Sheet Data -
The balance sheet data is imported with final balances for each account per month in the format shown in the following table.
There is always a row for each account for each month in the balance sheet data.
Dynamics 365 Business Central Data
Business Central contains a product catalog that shows how products roll up to product categories, which roll up to business units.
Revenue data is provided at the date and product level. Expense data is provided at the date and department level.
Business Issues -
Historically, it has taken two analysts a week to prepare the reports for the quarterly board meetings. Also, there is usually at least one issue each quarter where a value in a report is wrong because of a bad cell reference in an Excel formula. On occasion, there are conflicting results in the reports because the products and departments that roll up to each business unit are not defined consistently.
Requirements -
Planned Changes -
Contoso plans to automate and standardize the quarterly reporting process by using Microsoft Power BI. The company wants to how long it takes to populate reports to less than two days. The company wants to create common logic for business units, products, and departments to be used across all reports, including, but not limited, to the quarterly reporting for the board.
Technical Requirements -
Contoso wants the reports and datasets refreshed with minimal manual effort.
The company wants to provide a single package of reports to the board that contains custom navigation and links to supplementary information.
Maintenance, including manually updating data and access, must be minimized as much as possible.
Security Requirements -
The reports must be made available to the board from powerbi.com. A mail-enabled security group will be used to share information with the board.
The analysts responsible for each business unit must see all the data the board sees, except the profit and loss data, which must be restricted to only their business unit's data. The analysts must be able to build new reports from the dataset that contains the profit and loss data, but any reports that the analysts build must not be included in the quarterly reports for the board. The analysts must not be able to share the quarterly reports with anyone.
Report Requirements -
You plan to relate the balance sheet to a standard date table in Power BI in a many-to-one relationship based on the last day of the month. At least one of the balance sheet reports in the quarterly reporting package must show the ending balances for the quarter, as well as for the previous quarter.
Projections must contain a column named RevenueProjection that contains the revenue projection amounts. A relationship must be created from Projections to a table named Date that contains the columns shown in the following table.
The definitions and attributes of products, departments, and business units must be consistent across all reports.
The board must be able to get the following information from the quarterly reports:
Revenue trends over time
Ending balances for each account
A comparison of expenses versus projections by quarter
Changes in long-term liabilities from the previous quarter
A comparison of quarterly revenue versus the same quarter during the prior year
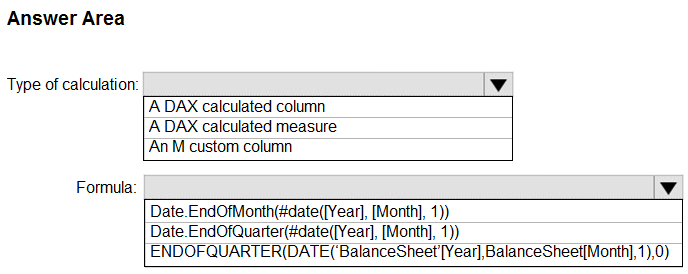
HOTSPOT -
You need to calculate the last day of the month in the balance sheet data to ensure that you can relate the balance sheet data to the Date table.
Which type of calculation and which formula should you use? To answer, select the appropriate options in the answer area.
NOTE: Each correct selection is worth one point.
Hot Area:
Answer : 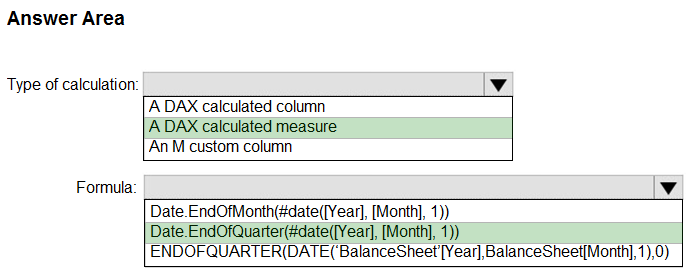
Explanation:
Box 1: A DAX Calculated measure -
Box 2: Date.EndofQuarter(#date([Year],[Mont],1))
ENDOFQUARTER returns the last date of the quarter in the current context for the specified column of dates.
The following sample formula creates a measure that returns the end of the quarter, for the current context.
= ENDOFQUARTER(DateTime[DateKey])
Reference:
https://docs.microsoft.com/en-us/dax/endofquarter-function-dax
Model the Data -
Question 5
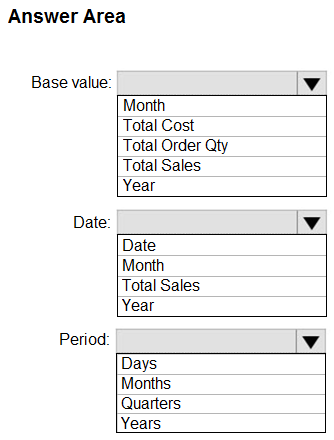
HOTSPOT -
You are creating a quick measure as shown in the following exhibit.
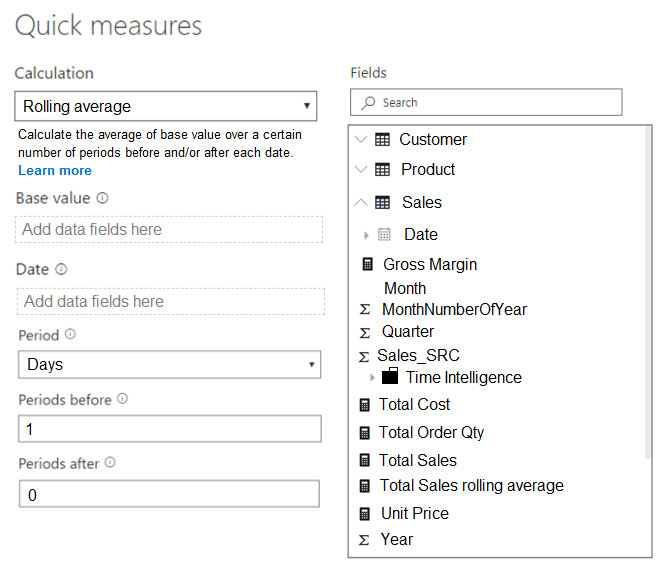
You need to create a monthly rolling average measure for Sales over time.
How should you configure the quick measure calculation? To answer, select the appropriate options in the answer area.
NOTE: Each correct selection is worth one point.
Hot Area:
Answer : 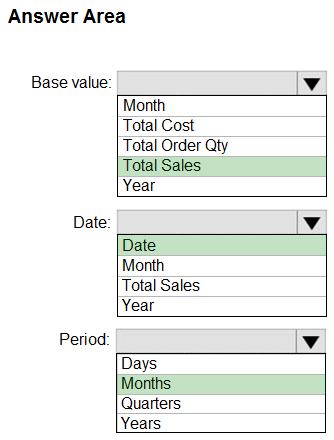
Explanation:
Box 1: Total Sales -
We select the field Total Sales -
Box 2: Date -
Select a date field.
Box 3: Month -
Monthly periods.
Reference:
https://docs.microsoft.com/en-us/power-bi/transform-model/desktop-quick-measures
Question 6
You have four sales regions. Each region has multiple sales managers.
You implement row-level security (RLS) in a data model. You assign the relevant distribution lists to each role.
You have sales reports that enable analysis by region. The sales managers can view the sales records of their region. The sales managers are prevented from viewing records from other regions.
A sales manager changes to a different region.
You need to ensure that the sales manager can see the correct sales data.
What should you do?
- A. Change the Microsoft Power BI license type of the sales manager.
- B. From Microsoft Power BI Desktop, edit the Row-Level Security setting for the reports.
- C. Request that the sales manager be added to the correct Azure Active Directory group.
- D. Manage the permissions of the underlying dataset.
Answer : C
Explanation:
Using AD Security Groups, you no longer need to maintain a long list of users.
All that you will need to do is to put in the AD Security group with the required permissions and Power BI will do the REST! This means a small and simple security file with the permissions and AD Security group.
Note: Configure role mappings -
Once published to Power BI, you must map members to dataset roles.
Members can be user accounts or security groups. Whenever possible, we recommend you map security groups to dataset roles. It involves managing security group memberships in Azure Active Directory. Possibly, it delegates the task to your network administrators.
Reference:
https://www.fourmoo.com/2018/02/20/dynamic-row-level-security-is-easy-with-active-directory-security-groups/ https://docs.microsoft.com/en-us/power-bi/guidance/rls-guidance
Question 7
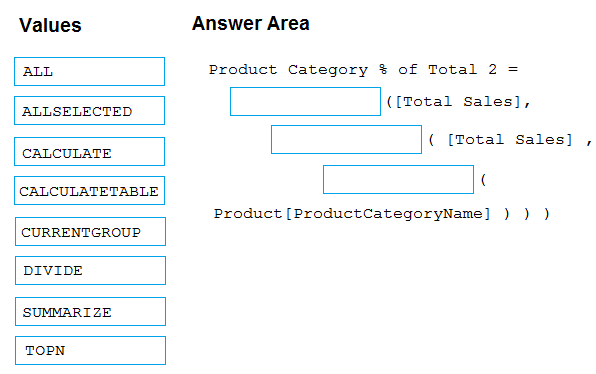
DRAG DROP -
You have a Microsoft Power BI data model that contains three tables named Sales, Product, and Date.
The Sales table has an existing measure named [Total Sales] that sums the total sales from the Sales table.
You need to write a calculation that returns the percentage of total sales that a selected ProductCategoryName value represents. The calculation must respect any slicers on ProductCategoryName and must show the percentage of visible total sales. For example, if there are four ProductCategoryName values, and a user filters one out, a table showing ProductCategoryName and the calculation must sum up to 100 percent.
How should you complete the calculation? To answer, drag the appropriate values to the correct targets. Each value may be used once, more than once, or not at all. You may need to drag the split bar between panes or scroll to view content.
NOTE: Each correct selection is worth one point.
Select and Place:
Answer : 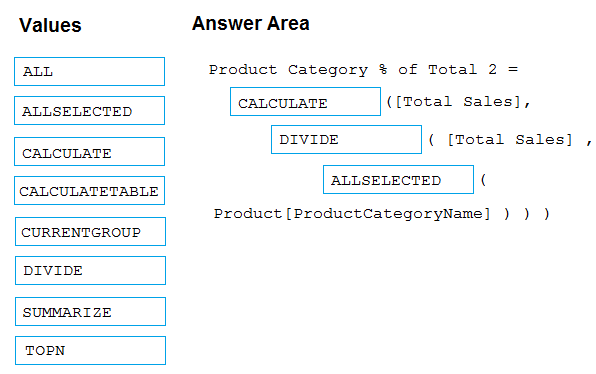
Explanation:
Box 1: CALCULATE -
CALCULATE rvaluates an expression in a modified filter context.
Box 2: DIVIDE -
As a data modeler, when you write a DAX expression to divide a numerator by a denominator, you can choose to use the DIVIDE function or the divide operator (/
- forward slash).
When using the DIVIDE function, you must pass in numerator and denominator expressions.
Box 3: ALLSELECTED -
ALLSELECTED removes context filters from columns and rows in the current query, while retaining all other context filters or explicit filters.
The ALLSELECTED function gets the context that represents all rows and columns in the query, while keeping explicit filters and contexts other than row and column filters. This function can be used to obtain visual totals in queries.
Example:
measure 'Reseller Sales'[Reseller Visual Total]=calculate(sum('Reseller Sales'[Sales Amount]), ALLSELECTED())
Reference:
https://docs.microsoft.com/en-us/dax/allselected-function-dax
Question 8
You have sales data in a star schema that contains four tables named Sales, Customer, Date, and Product. The Sales table contains purchase and ship dates.
Most often, you will use the purchase date to analyze the data, but you will analyze the data by both dates independently and together.
You need to design an imported dataset to support the analysis. The solution must minimize the model size and the number of queries against the data source.
Which data modeling design should you use?
- A. Use the Auto Date/Time functionality in Microsoft Power BI and do NOT import the Date table.
- B. Duplicate the Date query in Power Query and use active relationships between both Date tables.
- C. On the Date table, use a reference query in Power Query and create active relationships between Sales and both Date tables in the modeling view.
- D. Create an active relationship between Sales and Date for the purchase date and an inactive relationship for the ship date.
Answer : D
Explanation:
Only one relationship can be active.
Note: If you query two or more tables at the same time, when the data is loaded, Power BI Desktop attempts to find and create relationships for you. The relationship options Cardinality, Cross filter direction, and Make this relationship active are automatically set.
Reference:
https://docs.microsoft.com/en-us/power-bi/transform-model/desktop-create-and-manage-relationships
Question 9
You build a report to analyze customer transactions from a database that contains the tables shown in the following table.
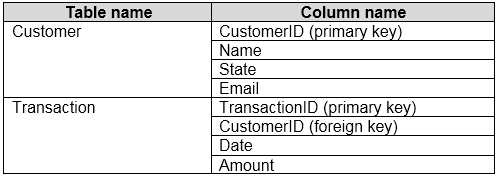
You import the tables.
Which relationship should you use to link the tables?
- A. many-to-many between Customer and Transaction
- B. one-to-many from Transaction to Customer
- C. one-to-many from Customer to Transaction
- D. one-to-one between Customer and Transaction
Answer : C
Explanation:
Each customer can have many transactions.
For each transaction there is exactly one customer.
Question 10
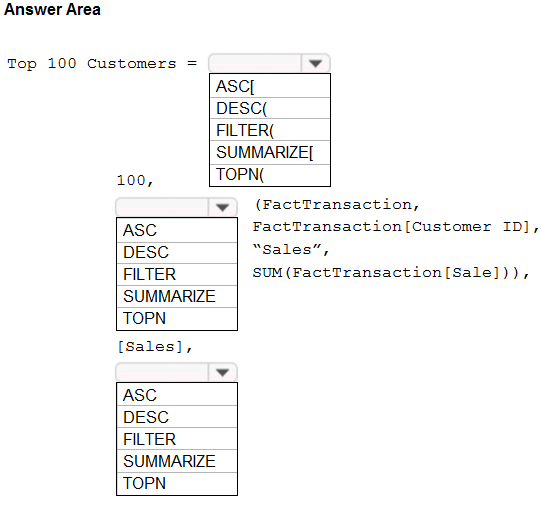
HOTSPOT -
You have a Power BI report.
You need to create a calculated table to return the 100 highest spending customers.
How should you complete the DAX expression? To answer, select the appropriate options in the answer area.
NOTE: Each correct selection is worth one point.
Hot Area:
Answer : 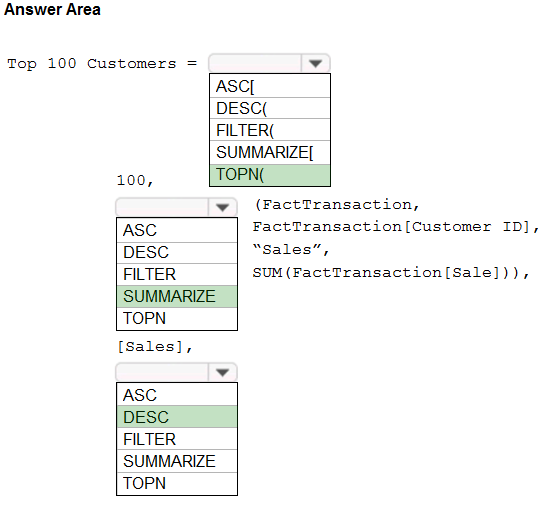
Explanation:
Box 1: TOPN -
TOPN returns the top N rows of the specified table.
Box 2: SUMMARIZE -
SUMMARIZE returns a summary table for the requested totals over a set of groups.
Box 3: DESC -
Sort in descending order.
It is last in the TOPN command.
TOPN syntax:
TOPN(<n_value>, <table>, <orderBy_expression>, [<order>[, <orderBy_expression>, [<order>]]ג€¦])
Reference:
https://docs.microsoft.com/en-us/dax/topn-function-dax
https://docs.microsoft.com/en-us/dax/summarize-function-dax
Question 11
HOTSPOT -
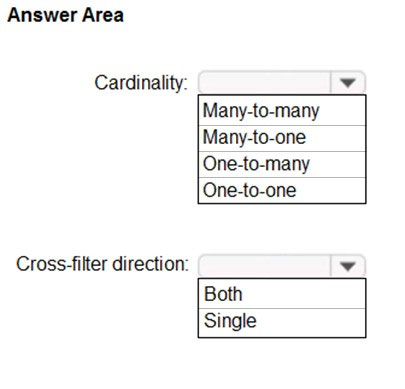
You have two tables named Customers and Invoice in a Power BI model. The Customers table contains the following fields:
✑ CustomerID
✑ Customer City
✑ Customer State
✑ Customer Name
✑ Customer Address 1
✑ Customer Address 2
✑ Customer Postal Code
The Invoice table contains the following fields:
✑ Order ID
✑ Invoice ID
✑ Invoice Date
✑ Customer ID
✑ Total Amount
✑ Total Item Count
The Customers table is related to the Invoice table through the Customer ID columns. A customer can have many invoices within one month.
The Power BI model must provide the following information:
✑ The number of customers invoiced in each state last month
✑ The average invoice amount per customer in each postal code
You need to define the relationship from the Customers table to the Invoice table. The solution must optimize query performance.
What should you configure? To answer, select the appropriate options in the answer area.
NOTE: Each correct selection is worth one point.
Hot Area:
Answer : 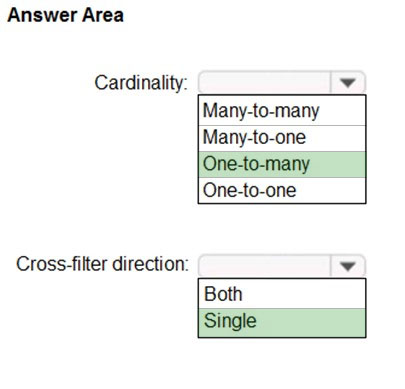
Explanation:
Box 1: One-to-many -
A customer can have many invoices within one month.
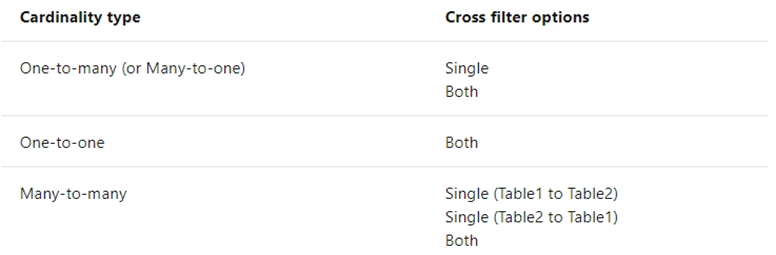
Box 2: Single -
For One-to-many relationships, the cross filter direction is always from the "one" side, and optionally from the "many" side (bi-directional). For
Single cross filter direction means "single direction", and Both means "both directions". A relationship that filters in both directions is commonly described as bi- directional.
Reference:
https://docs.microsoft.com/en-us/power-bi/transform-model/desktop-relationships-understand
Question 12
You have a Microsoft Power BI data model that contains three tables named Orders, Date, and City. There is a one-to-many relationship between Date and
Orders and between City and Orders.
The model contains two row-level security (RLS) roles named Role1 and Role2. Role1 contains the following filter.
City[State Province] = "Kentucky"
Role2 contains the following filter.
Date[Calendar Year] = 2020 -
If a user is a member of both Role1 and Role2, what data will they see in a report that uses the model?
- A. The user will see data for which the State Province value is Kentucky and the Calendar Year is 2020.
- B. The user will see data for which the State Province value is Kentucky or the Calendar Year is 2020.
- C. The user will see only data for which the State Province value is Kentucky.
- D. The user will receive an error and will not be able to see the data in the report.
Answer : B
Explanation:
When a report user is assigned to multiple roles, RLS filters become additive. It means report users can see table rows that represent the union of those filters.
Reference:
https://docs.microsoft.com/en-us/power-bi/guidance/rls-guidance
Question 13
HOTSPOT -
Your company has affiliates who help the company acquire customers.
You build a report for the affiliate managers at the company to assist them in understanding affiliate performance.
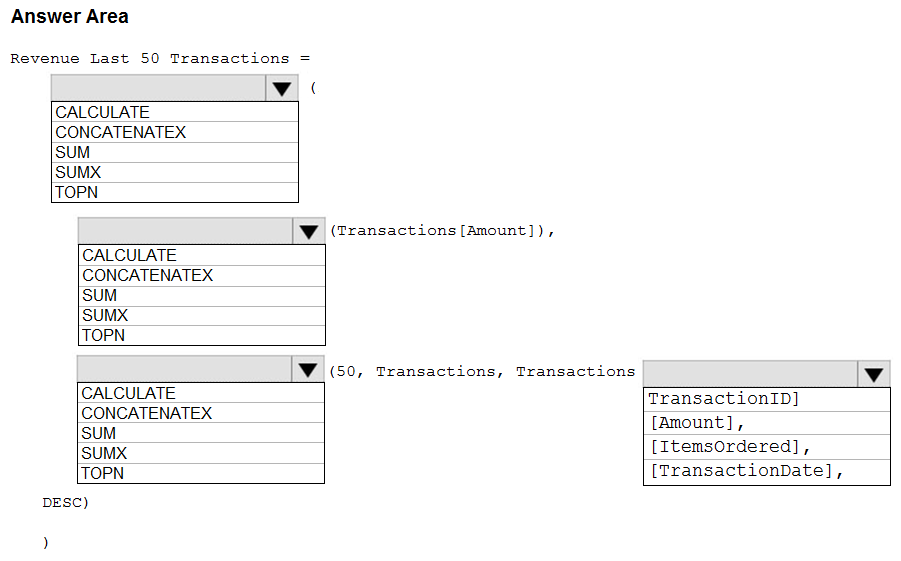
The managers request a visual showing the total sales value of the latest 50 transactions for each affiliate. You have a data model that contains the following tables.
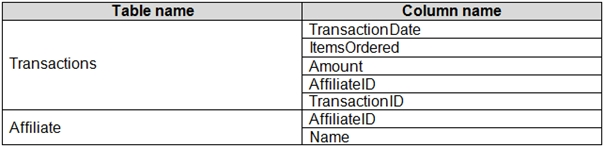
The Affiliate table has a one-to-many relationship to the Transactions table based on the AffiliateID column.
You need to develop a measure to support the visual.
How should you complete the DAX expression? To answer, select the appropriate options in the answer area.
NOTE: Each correct selection is worth one point.
Hot Area:
Answer : 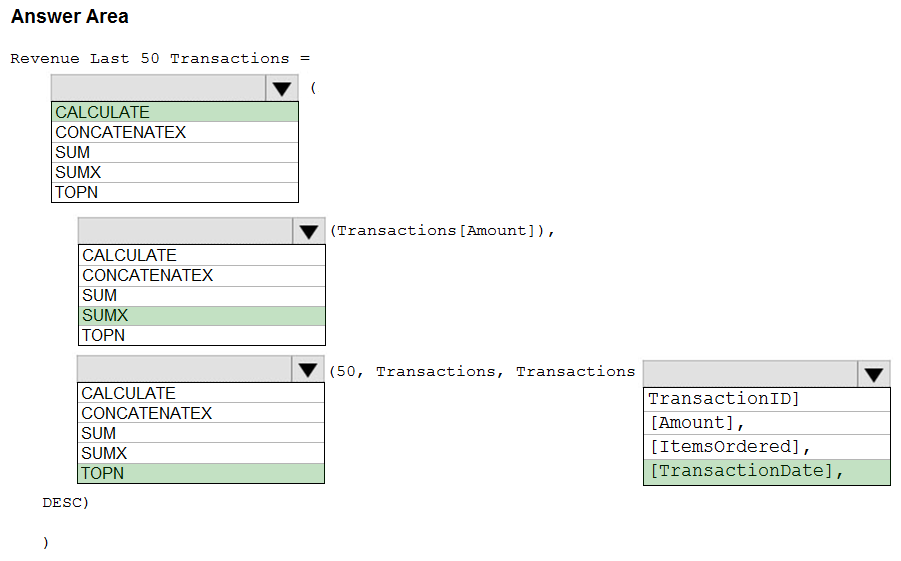
Explanation:
Box 1: CALCULATE -
Start with CALCULATE and use a SUMX.
CALCULATE evaluates an expression in a modified filter context.
Box 2: SUMX -
SUMX returns the sum of an expression evaluated for each row in a table.
The following sample creates a measure with the sales of the top 10 sold products.
= SUMX(TOPN(10, SUMMARIZE(Product, [ProductKey], "TotalSales", SUMX(RELATED(InternetSales_USD[SalesAmount_USD]), InternetSales_USD
[SalesAmount_USD]) + SUMX(RELATED(ResellerSales_USD[SalesAmount_USD]), ResellerSales_USD[SalesAmount_USD]))
Box 3: TOPN -
TOPN returns the top N rows of the specified table.
Box 4: [TransactionDate]
TOPN Syntax: TOPN(<n_value>, <table>, <orderBy_expression>, [<order>[, <orderBy_expression>, [<order>]]ג€¦])
The orderBy_expression: Any DAX expression where the result value is used to sort the table and it is evaluated for each row of table.
Reference:
https://docs.microsoft.com/en-us/dax/topn-function-dax
Question 14
You are configuring a Microsoft Power BI data model to enable users to ask natural language questions by using Q&A.
You have a table named Customer that has the following measure.
Customer Count = DISTINCTCOUNT(Customer[CustomerID])
Users frequently refer to customers as subscribers.
You need to ensure that the users can get a useful result for "subscriber count" by using Q&A. The solution must minimize the size of the model.
What should you do?
- A. Set Summarize By to None for the CustomerID column.
- B. Add a synonym of "subscriber" to the Customer table.
- C. Add a synonym of "subscriberID" to the CustomerID column.
- D. Add a description of "subscriber count" to the Customer Count measure.
Answer : B
Explanation:
You can add synonyms to tables and columns.
Note: This step applies specifically to Q&A (and not to Power BI reports in general). Users often have a variety of terms they use to refer to the same thing, such as total sales, net sales, total net sales. You can add these synonyms to tables and columns in the Power BI model.
This step applies specifically to Q&A (and not to Power BI reports in general). Users often have a variety of terms they use to refer to the same thing, such as total sales, net sales, total net sales. You can add these synonyms to tables and columns in the Power BI model.
Reference:
https://docs.microsoft.com/en-us/power-bi/natural-language/q-and-a-best-practices
Question 15
HOTSPOT -
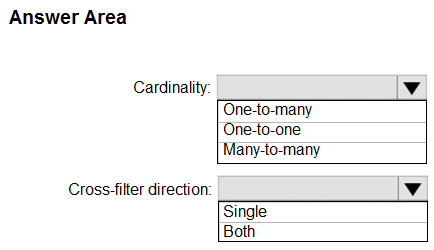
You are creating a Microsoft Power BI data model that has the tables shown in the following table.
The Products table is related to the ProductCategory table through the ProductCategoryID column.
You need to ensure that you can analyze sales by product category.
How should you configure the relationships from Products to ProductCategory? To answer, select the appropriate options in the answer area.
NOTE: Each correct selection is worth one point.
Hot Area:
Answer : 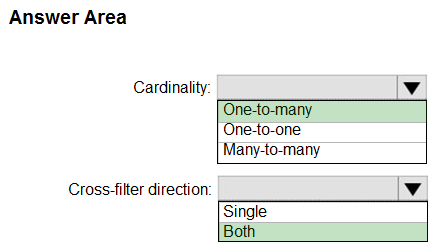
Explanation:
Box 1: One-to-many -
Box 2: Both -
For One-to-many relationships, the cross filter direction is always from the "one" side, and optionally from the "many" side (bi-directional).
Note:
Reference:
https://docs.microsoft.com/en-us/power-bi/transform-model/desktop-relationships-understand
Visualize the Data -