Analyzing and Visualizing Data with Microsoft Excel v1.0
Question 1
You have an Excel workbook query that loads data to a worksheet and the data model.
You need to ensure that the data is refreshed whenever you open the workbook.
What should you do?
- A. From the File tab, click Options, and then modify the General options
- B. From the Power Pivot model, modify the Table Behavior setting
- C. From the File tab, click Options, and then modify the Data options
- D. Run the Data tab, click Queries & Connections, and then edit the properties of the query
Answer : D
References:
https://support.office.com/en-us/article/refresh-connected-imported-data-e76a38b0-e2e1-400b-9f2f-c87b9b18c092
Question 2
DRAG DROP -
You use a workbook query to import a table named Customers that contains a column named CustomerName. CustomerName has names in the format of
Lastname, Firstname.
You need the CustomerName column to contain names in the format of Firstname Lastname. A space must separate Firstname and Lastname.
Which two commands should you use? To answer, drag the appropriate commands to the correct areas. Each command may be used once, more than once, or not at all. You may need to drag the split bar between panes or scroll to view content.
NOTE: Each correct selection is worth one point.
Select and Place:
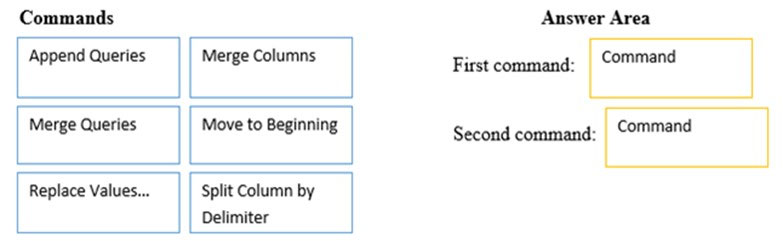
Answer : 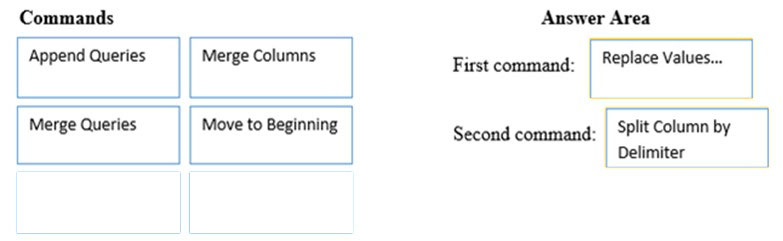
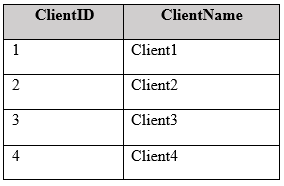
Question 3
You have two queries named Client and Invoices. A sample of Client is shown in the following table.
A sample of Invoices is shown in the following table.
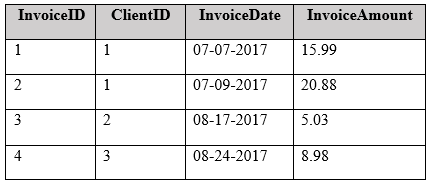
You need to create a new table that has the following information.
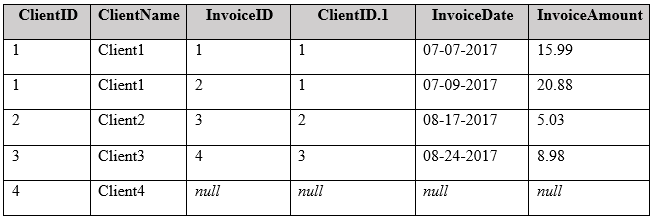
Which join kind should you use?
- A. Left Outer
- B. Left Anti
- C. Inner
- D. Right Anti
Answer : A
Question 4
You have a workbook query that loads the following table
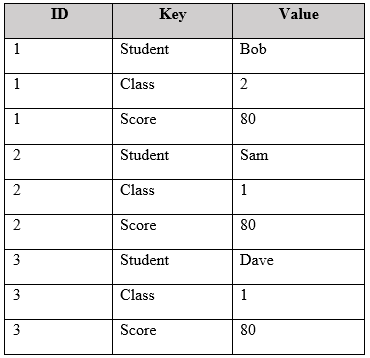
You pivot the table on the Key column by using Value as the values column, and you receive the results shown in the following table.
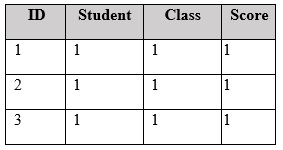
You need to ensure that the data appears as shown in the following table.
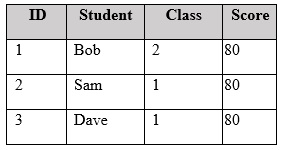
What should you do?
- A. Change the Aggregate Value Function of the pivot
- B. Change the Data Type of the Value column
- C. Select the ID column, and then click Unpivot Columns
- D. Delete the Pivoted Column step. Select the Key column, and then click Unpivot Columns
Answer : C
References:
https://support.office.com/en-us/article/unpivot-columns-power-query-0f7bad4b-9ea1-49c1-9d95-f588221c7098
Question 5
You need to create a PivotChart that has a filter as shown in the following exhibit.
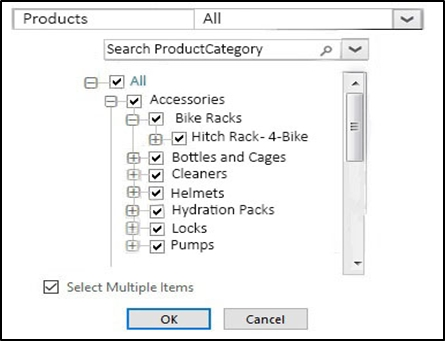
What should you do first?
- A. From the model, create a measure
- B. From Query Editor, create a function
- C. From the model, create a hierarchy
- D. From Query Editor, create a parameter
Answer : A
References:
https://support.office.com/en-us/article/measures-in-power-pivot-86484821-a324-4da3-803b-82fd2e5033f4
Question 6
DRAG DROP -
You create a new workbook and add a table to a data model. The data is shown in the following table.
You need to create a visualization as shown in the following exhibit.
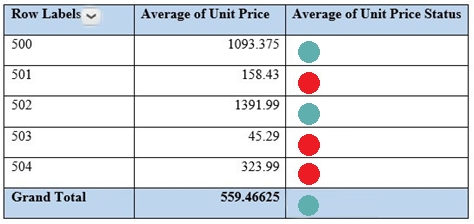
Which three actions should you perform in sequence? To answer, move the appropriate actions from the list of actions to the answer area and arrange them in the correct order.
Select and Place:
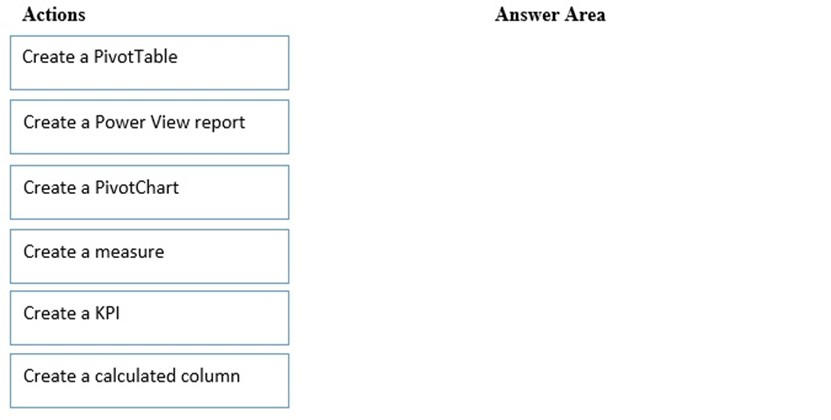
Answer : 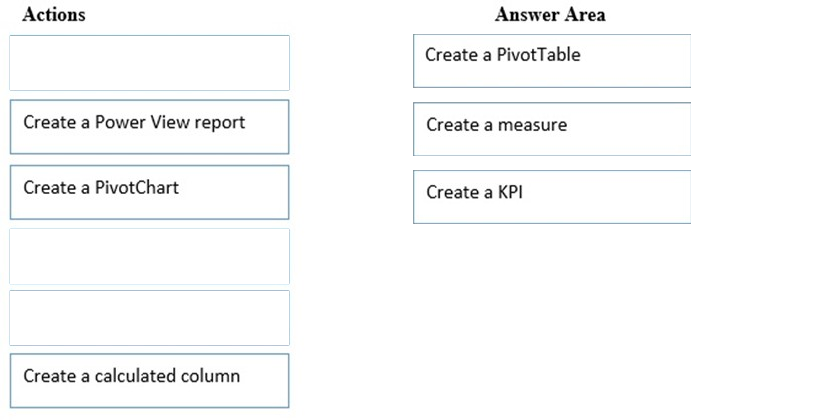
References:
https://support.office.com/en-us/article/create-a-measure-in-power-pivot-d3cc1495-b4e5-48e7-ba98-163022a71198?ui=en-US&rs=en-US&ad=US https://support.office.com/en-us/article/key-performance-indicators-kpis-in-power-pivot-e653edef-8a21-40e4-9ece-83a6c8c306aa
Question 7
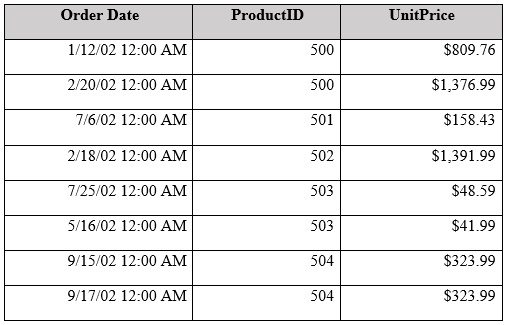
You have the following table.
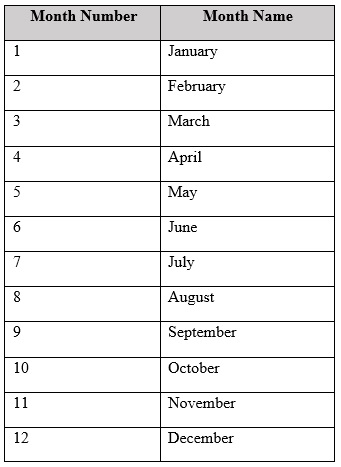
You plan to use [Month Name] as the axis in a PivotChart.
You need to ensure that whenever [Month Name] is used in a chart, the months are displayed chronologically by default.
What should you do?
- A. Add a calculated column named [ID] that uses the [Month Name]&[Month Number] DAX formula
- B. Change the Data Type of [Month Name] to Date
- C. Sort the [Month Number] column by [Month Name]
- D. Sort the [Month Name] column by [Month Number]
Answer : A
References:
https://gasperkamensek.wordpress.com/2013/04/16/sorting-months-chronologically-and-not-alphabetically-in-a-pivot-table-report-based-on-power- pivot-data/
Question 8
You have the data model shown in the Data Model exhibit. (Click the Exhibit button.)
Data Model exhibit:
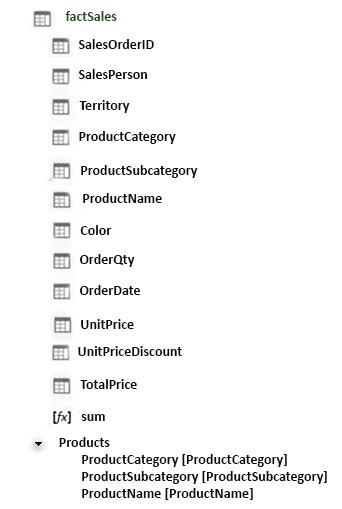
You have the PivotChart shown in the Pivot Chart exhibit. (Click the Exhibit button.)
Pivot Chart exhibit:
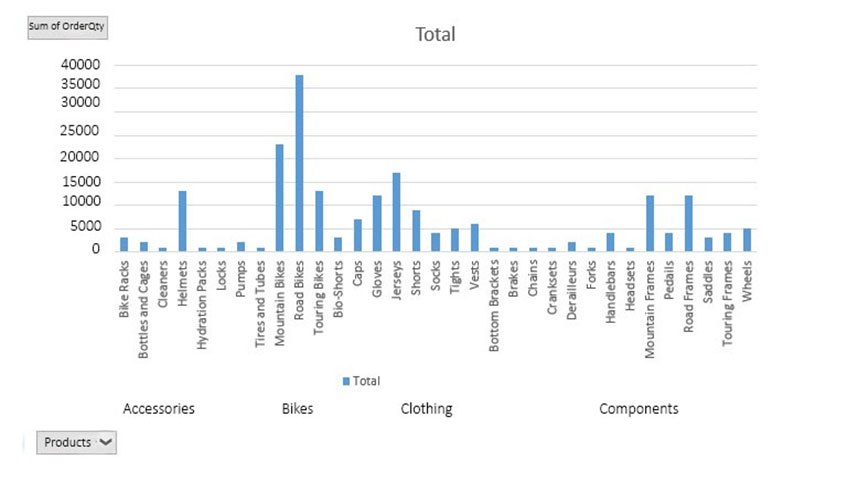
You need to change the current view of the PivotChart to display ProductCategory only.
What should you do?
- A. Right-click a bar in the PivotChart and click Expand Entire Field
- B. Right-click the PivotChart and click Reset to Match Style
- C. Click the + button
- D. Click the "" button
- E. Right-click a bar in the PivotChart and click Show All Fields
Answer : A
References:
https://support.office.com/en-us/article/expand-collapse-or-show-details-in-a-pivottable-or-pivotchart-d70d7e70-d230-4d45-81db-1f5e39bcb394
Question 9
DRAG DROP -
You have a model that contains the following table named Sales.
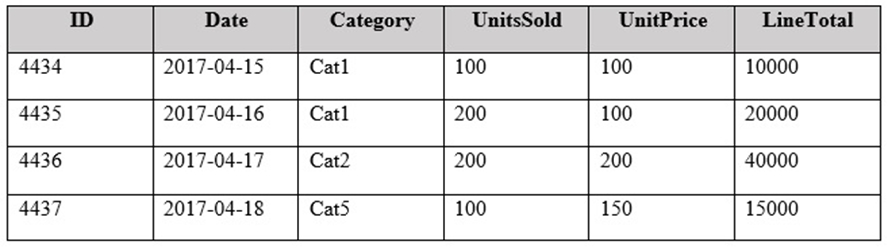
You have a measure named TotalSales that calculates the sum of LineTotal.
You plan to create a PivotChart to display TotalSales for each category and the percent of total sales for each category as shown in the following exhibit.
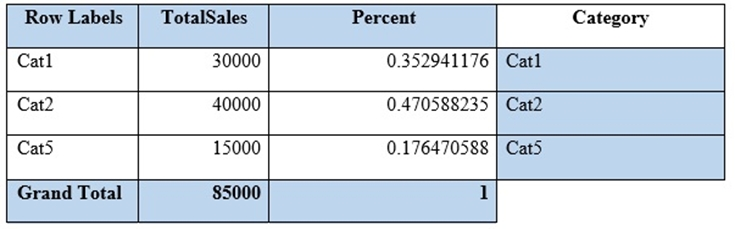
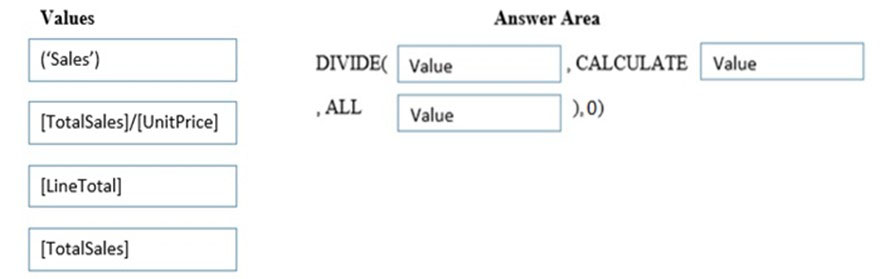
How should you complete the DAX formula for the Percent measure? To answer, drag the appropriate values to the correct areas. Each value may be used once, more than once, or not at all. You may need to drag the split bar between panes or scroll to view content.
NOTE: Each correct selection is worth one point.
Select and Place:
Answer : 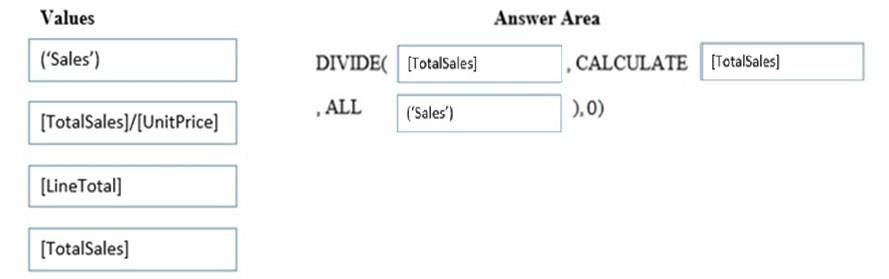
References:
https://www.fourmoo.com/2017/07/18/power-bi-dax-measures-for-excel-based-of-column-total-or-of-row-total/
Question 10
You have a table in a Power Pivot model that is loaded from a Microsoft SQL Server database.
The source table has four columns named ID, Price, Quantity, and Total. Total is derived by multiplying Price and Quantity. ID is a unique row identifier.
You need to minimize the amount of memory used to load the model. The solution must ensure that you can create visualizations based on Price, Quantity, and
Total.
What should you do?
- A. Replace the Total column by using a measure
- B. Replace the Total column by using a calculated column
- C. From Query Editor, remove duplicate rows from the table
- D. Move the Total column to a lookup table
Answer : A
References:
https://support.office.com/en-us/article/create-a-memory-efficient-data-model-using-excel-and-the-power-pivot-add-in-951c73a9-21c4-46ab-9f5e-
14a2833b6a70#__toc373850959
Question 11
You add two tables named Date and Invoices to a data model. Invoices contains a column named InvoiceDate that has a data Type of Date. Date contains a column named DateID that has a Data Type of Whole Number. DateID is in the format of YYYYMMDD.
You need to create a relationship between Date and Invoices.
What should you do first?
- A. Change the Data Type of InvoiceDate and DateID to Text
- B. Create a calculated column in Invoices that uses the FORMAT DAX function
- C. Change the Data Type of DateID to Date
- D. Create a measure in Invoices that uses the FORMAT DAX function
Answer : C
References:
https://support.office.com/en-us/article/data-types-in-data-models-e2388f62-6122-4e2b-bcad-053e3da9ba90?ui=en-US&rs=en-
US&ad=US#__toc319430522 -
Question 12
HOTSPOT -
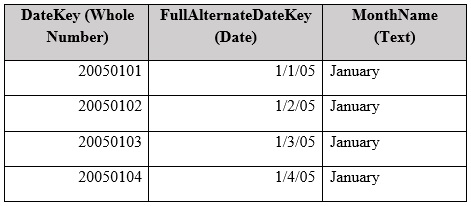
You have a table named Date that contains the following data.
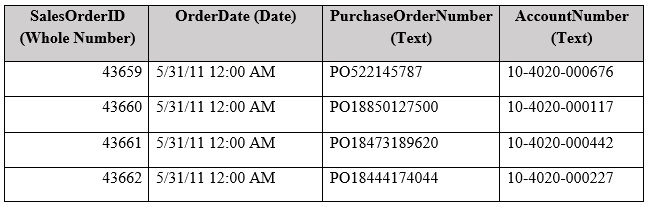
You have a table named Sales that contains the following data.
You plan to create a PivotCharts that will be sliced by MonthName.
You need to create a relationship between Sales and Date.
Which columns should you use to create the relationship? To answer, select the appropriate options in the answer area.
NOTE: Each correct selection is worth one point.
Hot Area:
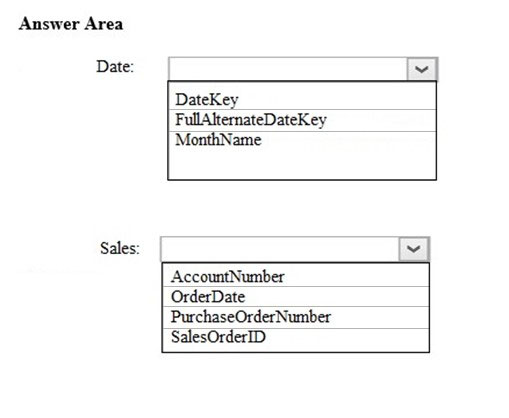
Answer : 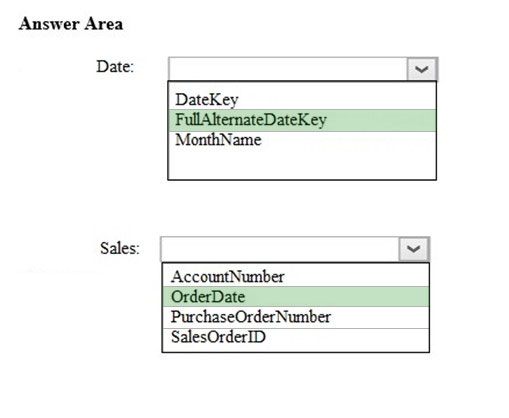
References:
https://support.office.com/en-us/article/create-a-relationship-between-tables-in-excel-fe1b6be7-1d85-4add-a629-8a3848820be3
Question 13
Note: This question is part of a series of questions that present the same scenario. Each question in the series contains a unique solution that might meet the stated goals. Some question sets might have more than one correct solution, while others might not have a correct solution.
After you answer a question in this section, you will NOT be able to return to it. As a result, these questions will not appear in the review screen.
You have two Microsoft SQL Server database servers named Production1 and Test1. Production1 contains the same tables as Test1, but only a subset of the data.
You add Test1 as a data source, and you select 10 tables. You configure several transformations.
You need to connect the model to the tables in Production1. The solution must maintain the existing transformations.
Solution: From Query Editor, you configure the Data source settings.
Does this meet the goal?
- A. Yes
- B. No
Answer : A
Question 14
Note: This question is part of a series of questions that present the same scenario. Each question in the series contains a unique solution that might meet the stated goals. Some question sets might have more than one correct solution, while others might not have a correct solution.
After you answer a question in this section, you will NOT be able to return to it. As a result, these questions will not appear in the review screen.
You have two Microsoft SQL Server database servers named Production1 and Test1. Production1 contains the same tables as Test1, but only a subset of the data.
You add Test1 as a data source, and you select 10 tables. You configure several transformations.
You need to connect the model to the tables in Production1. The solution must maintain the existing transformations.
Solution: From Query Editor, you edit the source of each table query.
Does this meet the goal?
- A. Yes
- B. No
Answer : B
Question 15
Note: This question is part of a series of questions that present the same scenario. Each question in the series contains a unique solution that might meet the stated goals. Some question sets might have more than one correct solution, while others might not have a correct solution.
After you answer a question in this section, you will NOT be able to return to it. As a result, these questions will not appear in the review screen.
You have two Microsoft SQL Server database servers named Production1 and Test1. Production1 contains the same tables as Test1, but only a subset of the data.
You add Test1 as a data source, and you select 10 tables. You configure several transformations.
You need to connect the model to the tables in Production1. The solution must maintain the existing transformations.
Solution: You create a new connection to Production1, and then you import the tables.
Does this meet the goal?
- A. Yes
- B. No
Answer : B