Analyzing and Visualizing Data with Microsoft Power BI v1.0
Question 1
You have the following tables.
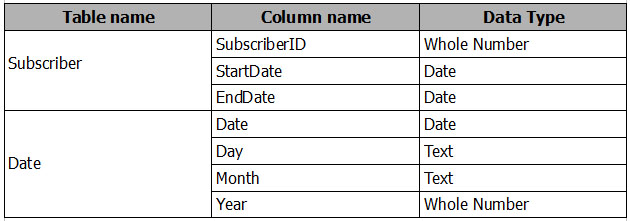
There is a many-to-one relationship from Subscriber to Date that uses Subscriber[StartDate] and Date[Date]. The Cross filter direction of the relationship is set to
Single.
You plan to create a column chart that displays the following two measures:
-> Count of SubscriberID by Month based on the StartDate
-> Count of SubscriberID by Month based on the EndDate
What should you do before you create the measures?
- A. Create an active one-to-one relationship from Subscriber[StartDate] to Date[Date].
- B. Change the Cross filter direction of the active relationship to Both.
- C. Change the active relationship for many-to-one.
- D. Create an inactive many-to-one relationship from Subscriber[StartDate] to Date[Date].
Answer : B
References:
https://docs.microsoft.com/en-us/power-bi/desktop-create-and-manage-relationships
Question 2
You have a Power BI report that displays a bar chart and a donut chart on the same page. The bar chart shows the total sales by year and the donut chart shows the total sale by category.
You need to ensure that when you select a year on the bar chart, the donut chart remains unchanged.
What should you do?
- A. Edit the interactions from the Format menu.
- B. Set a visual level filter on the bar chart.
- C. Set a visual level filter on the donut chart.
- D. Add a slicer to the page that uses the year column.
Answer : A
References:
https://www.excelguru.ca/blog/2016/11/23/visual-interactions-in-power-bi/
Question 3
You have a Power Pivot model that includes a KPI.
You need to create a visualization based on the Power Pivot model as shown in the exhibit. (Click the Exhibit button.)
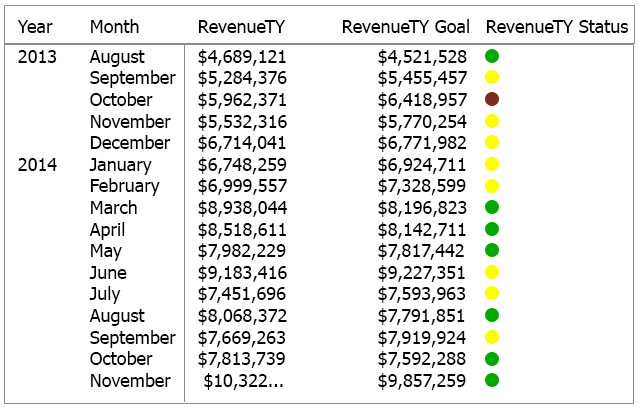
Which type of visualization should you use?
- A. matrix
- B. KPI
- C. multi row card
- D. table
Answer : B
Question 4
DRAG DROP -
You plan to create a report in Power BI Desktop.
You have the following tables.
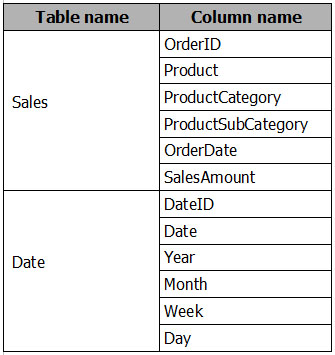
You have a measure that uses the following DAX formula.
Total Sales = SUM('Sales'[SalesAmount])
You plan to create a report to display TotalSales by ProductCategory and ProductSubCategory.
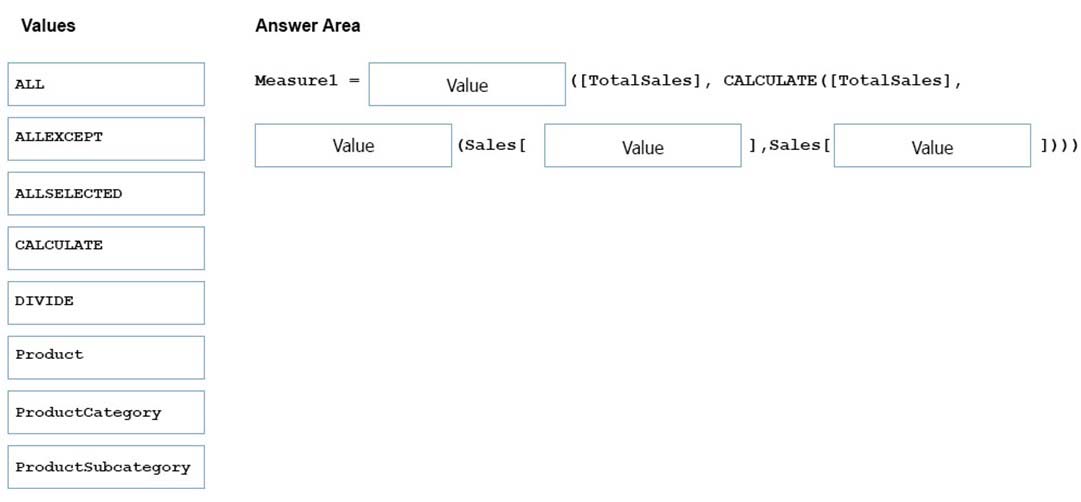
You need to create a measure to calculate the percentage of TotalSales for each ProductCategory.
How should you complete the DAX formula? To answer, drag the appropriate values to the correct targets. Each value may be used once, more than once, or not at all. You may need to drag the split bar between panes or scroll to view content.
NOTE: Each correct selection is worth one point.
Select and Place:
Answer : 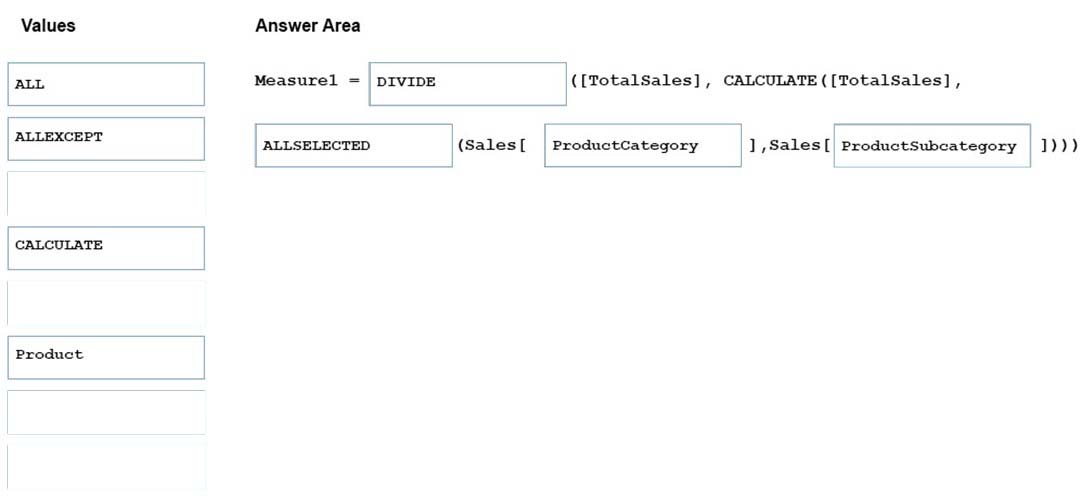
References:
https://support.office.com/en-us/article/when-to-use-calculated-columns-and-calculated-fields-ca18d63a-5b6d-4000-8ca2-14d2aadbb734
Question 5
Note: This question is part of a series of questions that use the same scenario. For your convenience, the scenario is repeated in each question. Each question presents a different goal and answer choices, but the text of the scenario is exactly the same in each question in this series.
Start of repeated scenario.
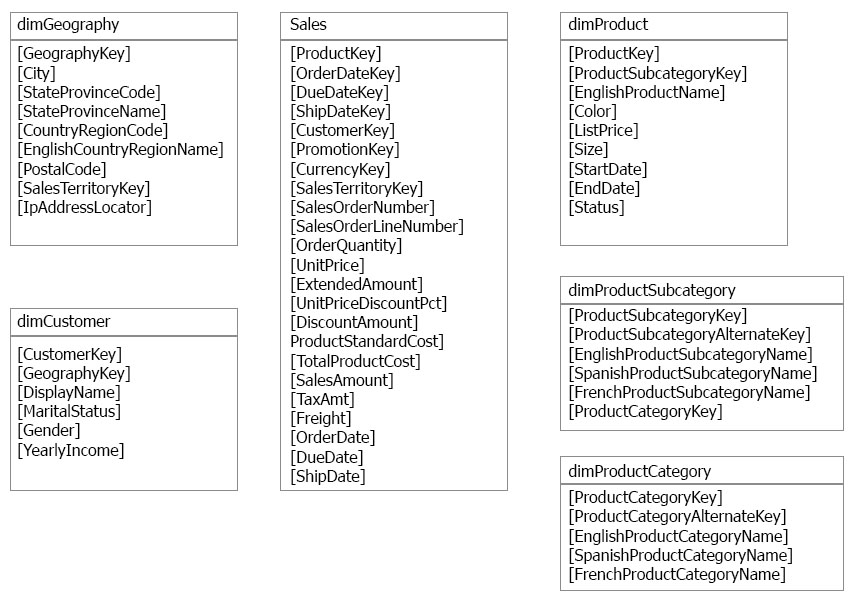
You have a Microsoft SQL Server database that has the tables shown in the Database Diagram exhibit. (Click the Database Diagram tab.)
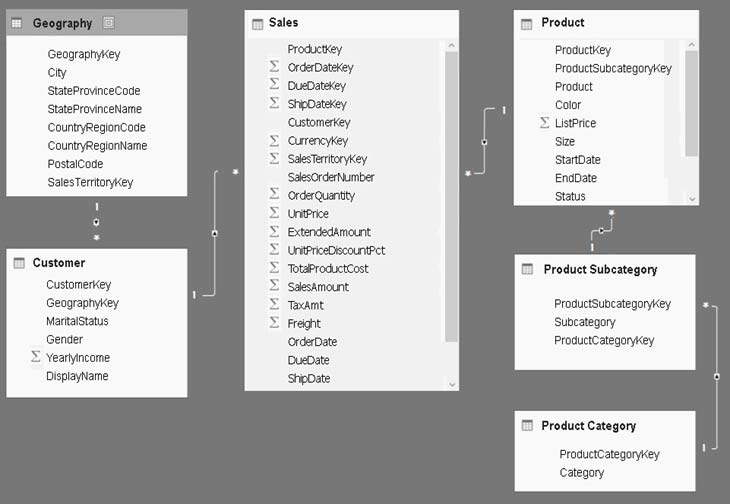
You plan to develop a Power BI model as shown in the Power BI Model exhibit. (Click the Power Bi model tab.)
You plan to use Power BI to import data from 2013 to 2015.
Product Subcategory[Subcategory] contains NULL values.
End of Repeated Scenario.
You implement the Power BI model.
You need to add a new column to the Product Subcategory table that uses the following formula.
=if [Subcategory]=null then "NA" else [Subcategory]
Which command should you use in Query Editor?
- A. Conditional Column
- B. Column From Examples
- C. Invoke Custom Function
- D. Custom Column
Answer : A
References:
http://community.powerbi.com/t5/Desktop/if-then-else/td-p/117999
Question 6
DRAG DROP -
Note: This question is part of a series of questions that use the same scenario. For your convenience, the scenario is repeated in each question. Each question presents a different goal and answer choices, but the text of the scenario is exactly the same in each question in this series.
Start of repeated scenario.
You have a Microsoft SQL Server database that has the tables shown in the Database Diagram exhibit. (Click the Database Diagram tab.)

You plan to develop a Power BI model as shown in the Power BI Model exhibit. (Click the Power Bi Model tab.)

You plan to use Power BI to import data from 2013 to 2015.
Product Subcategory[Subcategory] contains NULL values.
End of Repeated Scenario.
You are implementing the Power BI model.
You need to edit the Product Category query to match the desired Power BI model.
How should you complete the advanced query? To answer, drag the appropriate values to the correct targets. Each value may be used once, more than once, or not at all. You may need to drag the split bar between panes or scroll to view content.
NOTE: Each correct selection is worth one point.
Select and Place:
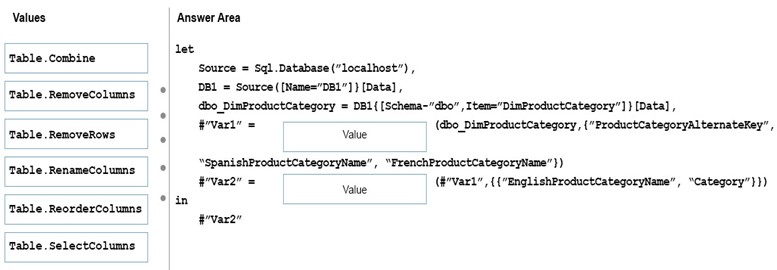
Answer : 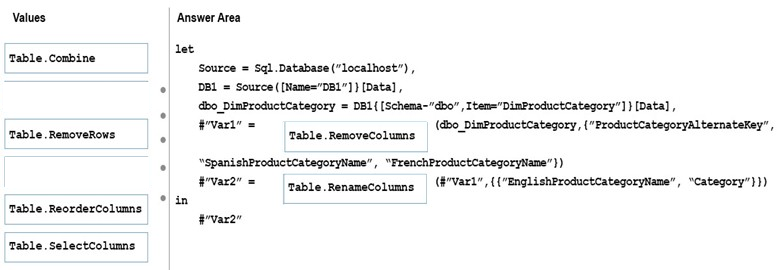
References:
https://msdn.microsoft.com/en-us/library/mt260776.aspx
https://msdn.microsoft.com/en-us/library/mt260808.aspx
Question 7
DRAG DROP -
Note: This question is part of a series of questions that use the same scenario. For your convenience, the scenario is repeated in each question. Each question presents a different goal and answer choices, but the text of the scenario is exactly the same in each question in this series.
Start of repeated scenario.
You have a Microsoft SQL Server database that has the tables shown in the Database Diagram exhibit. (Click the Database Diagram tab.)

You plan to develop a Power BI model as shown in the Power BI Model exhibit. (Click the Power BI Model tab.)

You plan to use Power BI to import data from 2013 to 2015.
Product Subcategory[Subcategory] contains NULL values.
End of Repeated Scenario.
You implement the Power BI model.
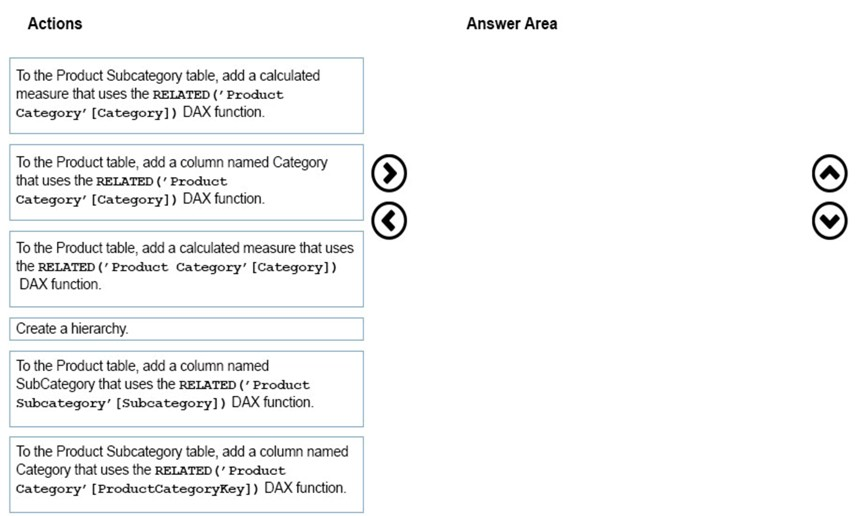
You need to create a hierarchy that has Category, Subcategory, and Product.
Which three actions should you perform in sequence? To answer, move the appropriate actions from the list of actions to the answer area and arrange them in the correct order.
NOTE: More than one order of answer choices is correct. You will receive credit for any of the correct orders you select.
Select and Place:
Answer : 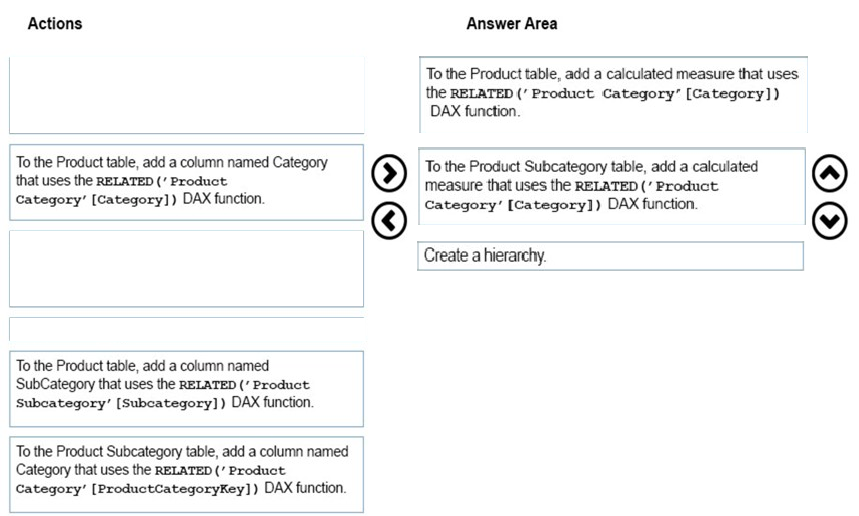
References:
https://intelligentsql.wordpress.com/2013/05/08/tabular-hierarchies-across-multiple-tables/ https://www.desertislesql.com/wordpress1/?p=1629
Question 8
Note: This question is part of a series of questions that use the same scenario. For your convenience, the scenario is repeated in each question. Each question presents a different goal and answer choices, but the text of the scenario is exactly the same in each question in this series.
Start of repeated scenario.
You have a Microsoft SQL Server database that has the tables shown in the Database Diagram exhibit. (Click the Database Diagram tab.)

You plan to develop a Power BI model as shown in the Power BI Model exhibit. (Click the Power Bi Model tab.)

You plan to use Power BI to import data from 2013 to 2015.
Product Subcategory[Subcategory] contains NULL values.
End of Repeated Scenario.
You implement the Power BI model.
You need to add a measure to rank total sales by product. The results must appear as shown in the following table.
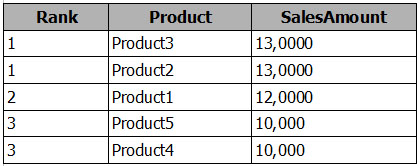
Which DAX formula should you use?
- A. Product Ranking = RANKX(ALL('Product'), [SalesAmount],,Asc, Dense)
- B. Product Ranking = RANKX(ALL('Product'), [SalesAmount],,DESC, Skip)
- C. Product Ranking = RANKX(ALL('Product'), [SalesAmount],,DESC, Dense)
- D. Product Ranking = RANKX(Product, [SalesAmount],,DESC, Skip)
Answer : C
References:
https://msdn.microsoft.com/en-us/library/gg492185.aspx
Question 9
Note: This question is part of a series of questions that use the same scenario. For your convenience, the scenario is repeated in each question. Each question presents a different goal and answer choices, but the text of the scenario is exactly the same in each question in this series.
Start of repeated scenario.
You have a Microsoft SQL Server database that has the tables shown in the Database Diagram exhibit. (Click the Database Diagram tab.)

You plan to develop a Power BI model as shown in the Power BI Model exhibit. (Click the Power Bi Model tab.)
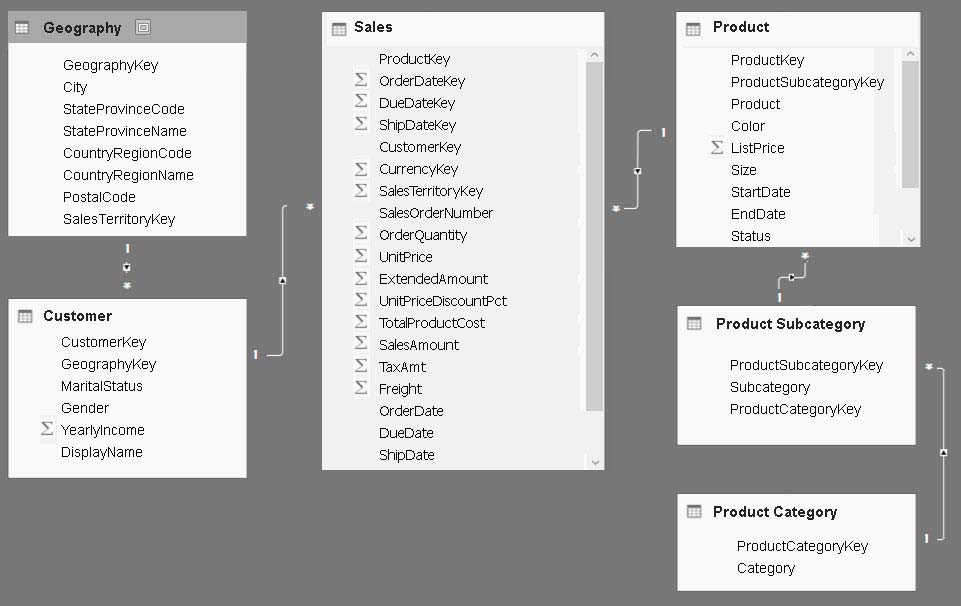
You plan to use Power BI to import data from 2013 to 2015.
Product Subcategory[Subcategory] contains NULL values.
End of Repeated Scenario.
You need to create a measure of Sales[SalesAmount] where Product[Color] is Red or Product[Size] is 50.
Which DAX formula should you use?
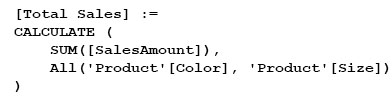
A.
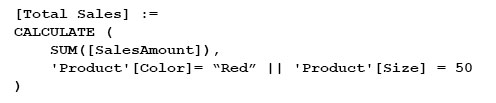
B.
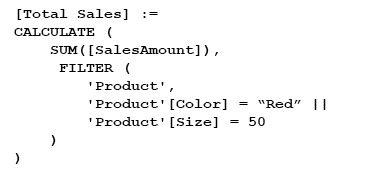
C.
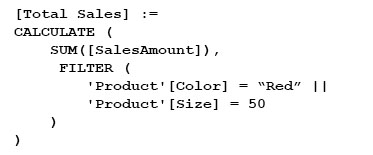
D.
Answer : C
References:
https://msdn.microsoft.com/query-bi/dax/filter-function-dax
Question 10
Note: This question is part of a series of questions that use the same scenario. For your convenience, the scenario is repeated in each question. Each question presents a different goal and answer choices, but the text of the scenario is exactly the same in each question in this series.
Start of repeated scenario.
You have a Microsoft SQL Server database that has the tables shown in the Database Diagram exhibit. (Click the Database Diagram tab.)

You plan to develop a Power BI model as shown in the Power BI Model exhibit. (Click the Power Bi Model tab.)

You plan to use Power BI to import data from 2013 to 2015.
Product Subcategory[Subcategory] contains NULL values.
End of Repeated Scenario.
You implement the Power BI model.
You add another table named Territory to the model. A sample of the data is shown in the following table.
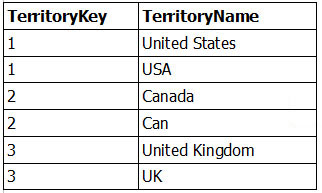
You need to create a relationship between the Territory table and the Sales table.
Which function should you use in the query for Territory before you create the relationship?
- A. Table.Distinct
- B. Table.IsDistinct
- C. Table.ReplaceMatchingRows
- D. Table.RemoveMatchingRows
Answer : A
References:
https://msdn.microsoft.com/en-us/library/mt260775.aspx
Question 11
Note: This question is part of a series of questions that use the same scenario. For your convenience, the scenario is repeated in each question. Each question presents a different goal and answer choices, but the text of the scenario is exactly the same in each question in this series.
Start of repeated scenario.
You have a Microsoft SQL Server database that has the tables shown in the Database Diagram exhibit. (Click the Database Diagram tab.)

You plan to develop a Power BI model as shown in the Power BI Model exhibit. (Click the Power Bi Model tab.)

You plan to use Power BI to import data from 2013 to 2015.
Product Subcategory[Subcategory] contains NULL values.
End of Repeated Scenario.
You implement the Power BI model.
You plan to add a table named Date to the model. The table will have columns for the date, year, month, and end of the last month, and will include data from
January 1, 2013 to December 31, 2015.
The Date table and the Sales table will have a relationship.
Which DAX functions should you use to create the columns?
- A. CALENDARAUTO, YEAR, MONTH, and EOMONTH
- B. CALENDAR, YEAR, MONTH, and ENDOFMONTH
- C. CALENDARAUTO, YEAR, MONTH, and ENDOFMONTH
- D. CALENDAR, YEAR, MONTH, and EOMONTH
Answer : D
References:
https://msdn.microsoft.com/en-us/query-bi/dax/calendar-function-dax https://msdn.microsoft.com/en-us/query-bi/dax/year-function-dax https://msdn.microsoft.com/en-us/query-bi/dax/month-function-dax https://msdn.microsoft.com/en-us/query-bi/dax/eomonth-function-dax
Question 12
You have two Microsoft SQL Server database servers named SQLProd and SQLDev. SQLDev contains the same tables as SQLProd, but only a subset of the data in SQLProd.
You create a new Power BI Desktop model that uses 120 tables from SQLDev.
You plan to publish the Power BI file to the Power BI service.
You need to connect the model to the tables in SQLProd. The solution must minimize administrative effort.
What should you do from Query Editor before you publish the model?
- A. Create a new connection to SQLProd, and then import the tables from SQLProd.
- B. Delete the existing queries, and then add new data sources.
- C. Configure the Data source settings.
- D. Edit the source of each table query.
Answer : D
References:
https://docs.microsoft.com/en-us/power-bi/desktop-analysis-services-tabular-data
Question 13
DRAG DROP -
You have a customer table in Power BI Desktop. The customer table contains the columns as shown in the following table.
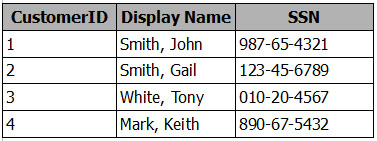
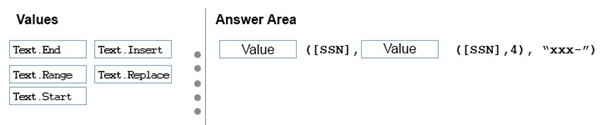
You need to create a custom column that hides the first three digits of the SSN. The values in the new column must have the xxx-99-9999 format.
How should you complete the Query Editor formula? To answer, drag the appropriate values to the correct targets. Each value may be used once, more than once, or not at all. You may need to drag the split bar between panes or scroll to view content.
NOTE: Each correct selection is worth one point.
Select and Place:
Answer : 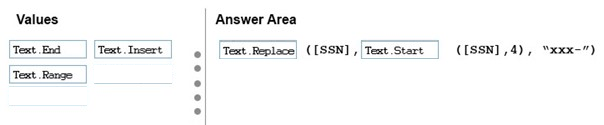
References:
https://msdn.microsoft.com/query-bi/m/text-replace
https://msdn.microsoft.com/en-us/query-bi/m/text-start
Question 14
You have a Power BI model that has a date table. A sample of the data shown in the following table.
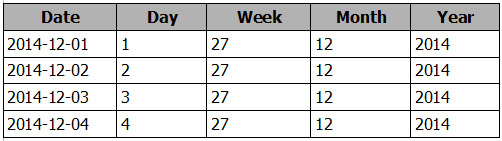
You need to add a column to display the date in the format of December 01, 2014.
Which DAX formula should you use in Power BI Desktop?
- A. FORMAT([Date], "MMM") & " " & FORMAT([Date], "DD") & ", " & FORMAT([Date], "YYYY")
- B. FORMAT([Date], "M") & " " & FORMAT([Date], "D") & ", " & [Date].[Year])
- C. [Date].[Month] & " " & FORMAT([Date], "D") & ", " & [Date].[Year])
- D. FORMAT([Date], "MMMM DD, YYYY")
Answer : D
Question 15
HOTSPOT -
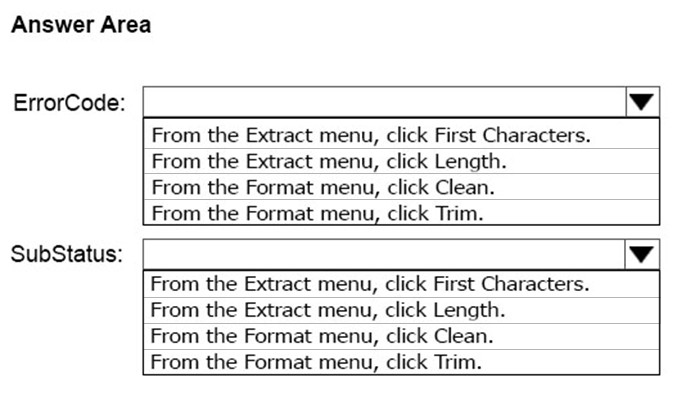
You have a query that retrieves data from a Microsoft Azure SQL database.
You discover that a column named ErrorCode has several values starting with a space character, and a column named SubStatus contains several non-printable characters.
You need to remove all the leading whitespaces from ErrorCode and all the non-printable characters from SubStatus. All other data must be retained.
What should you do on each column? To answer, select the appropriate options in the answer area.
NOTE: Each correct selection is worth one point.
Hot Area:
Answer : 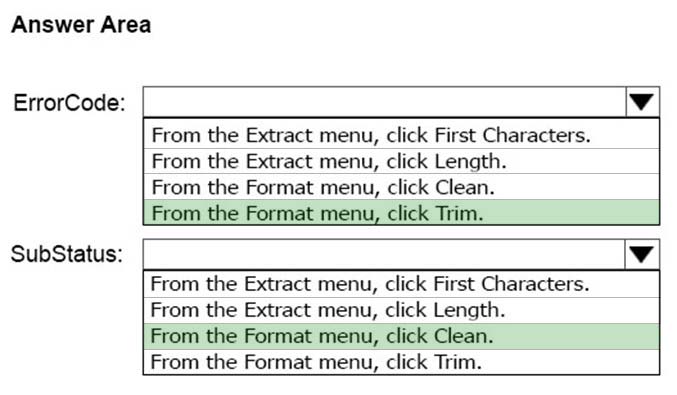
References:
https://msdn.microsoft.com/en-us/library/mt260494.aspx
https://msdn.microsoft.com/en-us/library/mt253328.aspx